
A healthy body weight by age is not one fixed number. For babies and children, clinicians use age-based growth charts, while for adults and most seniors, healthy weight is judged mainly by height, BMI, and waist size rather than age alone. This matters because the “right” chart changes as the body grows, matures, and ages. A baby, a 10-year-old, a 35-year-old, and a 75-year-old should not all be judged by the same scale.
The most useful way to understand a body weight chart by age is to break it into life stages. For infants, the best tool is the WHO Child Growth Standards used by CDC. For children and teens, the key measure is CDC BMI-for-age percentiles. For adults, the standard screening tool is CDC body mass index guidance, and for older adults, weight has to be interpreted with extra care because muscle loss and unintentional weight loss become more important with age.
Quick Body Weight Chart by Age
| Age group | Best tool to use | What “healthy” usually means |
|---|---|---|
| Birth to 2 years | WHO weight-for-length and growth charts | Growth tracking over time, not an adult-style BMI number |
| Ages 2 to 19 | BMI-for-age percentile | Healthy weight is the 5th percentile to less than the 85th percentile |
| Ages 20 and older | BMI by height and weight | Healthy weight is a BMI of 18.5 to 24.9 |
| Seniors | BMI plus muscle, waist size, function, and weight history | A healthy weight may be different than for a younger adult |
This summary reflects current guidance from CDC, NIDDK, and NIA.
Why There Is No Single Healthy Weight Chart for Every Age
A simple age-by-weight chart sounds helpful, but it is not how official health organizations assess healthy body size. In children, growth depends heavily on age and sex, so percentiles are used. In adults, weight is interpreted mainly in relation to height. In older adults, the number on the scale may miss important issues such as lower muscle mass, reduced strength, or unexplained weight loss. CDC growth chart guidance also notes that growth charts are not meant to be the only diagnostic tool.
Body Weight Chart by Age for Infants and Toddlers: Birth to 2 Years
For children younger than 2, CDC and the American Academy of Pediatrics recommend the WHO growth standards. These charts track weight-for-age, length-for-age, head circumference, and weight-for-length. CDC specifically says BMI-for-age is not recommended for children younger than 2 years.
Growth in babies and toddlers should be judged by a series of accurate measurements over time, not one weigh-in by itself. CDC notes that growth monitoring works best when clinicians look at the pattern across visits. For babies born early, pediatric clinicians may also use adjusted age when tracking growth and development during early follow-up, rather than relying only on chronological age, as explained by the American Academy of Pediatrics.
What Clinicians Look for Under Age 2
| Measure | What it helps show |
|---|---|
| Weight-for-age | Whether weight is tracking appropriately over time |
| Length-for-age | Linear growth |
| Weight-for-length | Whether weight is low or high for body length |
| Head circumference-for-age | Brain and skull growth in infancy |
CDC notes that for children under 2, low weight-for-length is below the 2nd percentile and high weight-for-length is above the 98th percentile on the WHO charts. At age 2, clinicians generally switch from WHO charts to CDC growth charts.
Body Weight Chart by Age for Children and Teens: Ages 2 to 19
For school-age children and teens, a healthy body weight is not a single number for each age. Instead, CDC uses BMI-for-age percentiles, which compare a child’s BMI with others of the same age and sex.
CDC Child and Teen BMI Categories
| Category | BMI-for-age percentile |
|---|---|
| Underweight | Less than the 5th percentile |
| Healthy weight | 5th percentile to less than the 85th percentile |
| Overweight | 85th percentile to less than the 95th percentile |
| Obesity | 95th percentile or greater |
CDC also includes a severe obesity category at 120% of the 95th percentile or greater, or a BMI of 35 kg/m² or greater for ages 2 to 19. Just as important, CDC says BMI percentile is not meant to be the sole diagnosis. It is a screening tool that should be interpreted along with growth patterns, medical history, diet, activity, and clinical judgment.
What This Means for Parents
A 7-year-old and a 15-year-old should not be expected to weigh the same for a given height pattern, and two children of the same age may still be perfectly healthy at different weights if their growth curves are normal. What matters most is whether a child is following a reasonable growth pattern over time, not whether they match a random internet chart.
Body Weight Chart by Age for Adults: Ages 20 and Older
For adults, the standard screening method is BMI. CDC describes BMI as a quick, low-cost, reliable screening measure of weight status, but it should be considered alongside other factors such as blood pressure, cholesterol, and physical exam findings.
Adult BMI Categories
| BMI | Category |
|---|---|
| Below 18.5 | Underweight |
| 18.5 to 24.9 | Healthy weight |
| 25.0 to 29.9 | Overweight |
| 30.0 and up | Obesity |
| 40.0 and up | Severe obesity |
These adult BMI cutoffs are used for people age 20 and older. They do not change by age, which is why a true adult “body weight chart by age” is really more of a body weight chart by height.
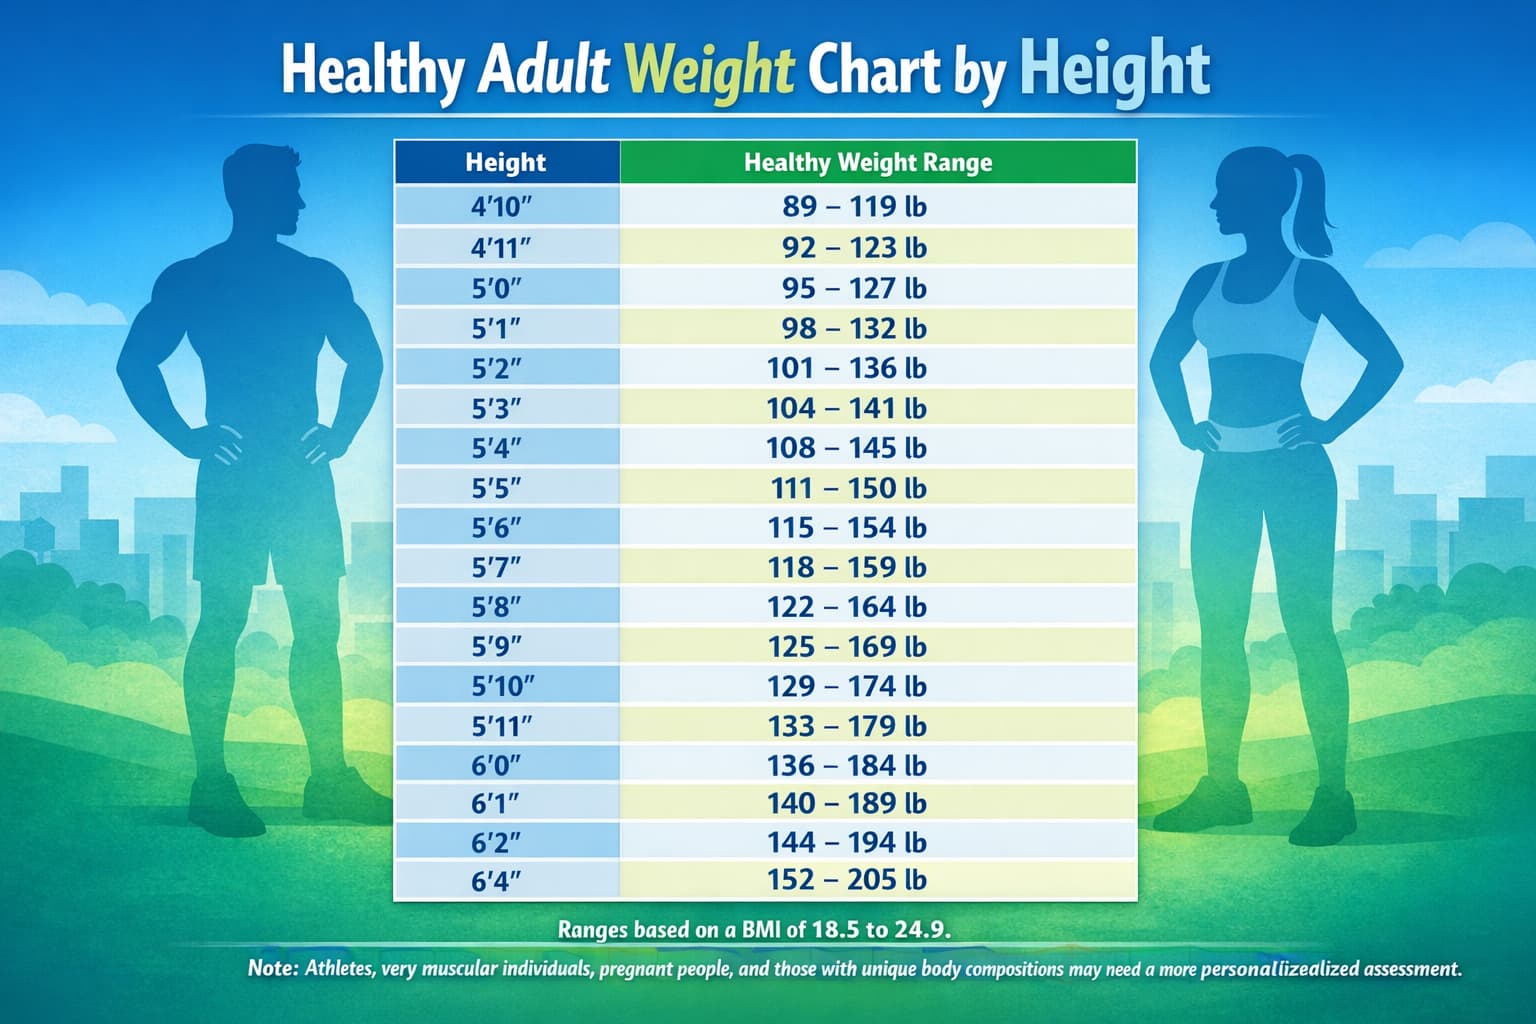
Healthy Adult Weight Chart by Height
The chart below shows approximate healthy adult weight ranges calculated from the CDC healthy BMI range of 18.5 to 24.9.
| Height | Healthy weight range |
|---|---|
| 4’10” | 89 to 119 lb |
| 4’11” | 92 to 123 lb |
| 5’0″ | 95 to 127 lb |
| 5’1″ | 98 to 132 lb |
| 5’2″ | 101 to 136 lb |
| 5’3″ | 104 to 141 lb |
| 5’4″ | 108 to 145 lb |
| 5’5″ | 111 to 150 lb |
| 5’6″ | 115 to 154 lb |
| 5’7″ | 118 to 159 lb |
| 5’8″ | 122 to 164 lb |
| 5’9″ | 125 to 169 lb |
| 5’10” | 129 to 174 lb |
| 5’11” | 133 to 179 lb |
| 6’0″ | 136 to 184 lb |
| 6’1″ | 140 to 189 lb |
| 6’2″ | 144 to 194 lb |
| 6’3″ | 148 to 199 lb |
| 6’4″ | 152 to 205 lb |
These ranges are practical estimates based on BMI, not exact health judgments for every individual. Very muscular adults, some athletes, pregnant people, and people with unusual body composition may need a more personalized assessment.
Waist Size Matters Too
Weight alone does not tell the whole story. According to NHLBI healthy weight guidance, a waist circumference above 35 inches for women or 40 inches for men raises the risk of heart disease and type 2 diabetes. That is why two adults with the same body weight may not have the same health risk.
How to Measure Waist Size Correctly
To measure waist circumference the right way, stand up and place a tape measure around your middle just above your hipbones. The tape should be snug but not compressing the skin. Measure your waist after you breathe out normally. According to the National Heart, Lung, and Blood Institute, a waist circumference of more than 35 inches for women who are not pregnant or more than 40 inches for men is linked with higher health risk.
Body Weight Chart by Age for Seniors
Older adults often search for a special senior weight chart, but official guidance is more nuanced. NIA guidance on maintaining a healthy weight says that healthy weight ranges for older adults are different than for other age groups, and that the number on the scale or an online BMI calculator tells only part of the story. NIDDK also says the weight that is healthiest for an older adult may be higher than that of a younger person.
What Matters More in Seniors
| Factor | Why it matters |
|---|---|
| BMI | Still useful as a screening tool |
| Muscle mass and strength | Aging is associated with muscle loss |
| Waist size | Helps show where body fat is carried |
| Function | Energy, mobility, balance, and independence matter |
| Weight history | Sudden loss can be more concerning than a stable higher weight |
It is also important not to focus only on excess weight in older adults. The National Institute of Diabetes and Digestive and Kidney Diseases notes that being underweight can also be a health concern in later life. It may be linked with weakness, bone loss, not getting enough calories, or an underlying illness. In seniors, a lower number on the scale is not always better if strength, appetite, and day-to-day function are slipping.
NIA notes that aging is associated with muscle loss, and staying active helps older adults maintain muscle mass and independence. This is one reason a “normal” scale weight does not always mean the same thing in a 75-year-old as it does in a 35-year-old.
When Weight Change Is a Warning Sign
A body weight chart is helpful, but unexpected change can matter more than a single number. MedlinePlus defines unintentional weight loss as losing 10 pounds or 5% of your usual body weight within 6 to 12 months or less without trying. This is especially important in older adults, because sudden weight loss may point to illness, poor nutrition, medication effects, swallowing problems, depression, or other issues that need medical attention.
How Age Changes What “Healthy Body Weight” Means
Healthy body weight shifts across life because the body itself changes.
Children
Children are still growing in height, bone, and body composition, so percentiles work better than fixed weight targets.
Adults
For adults, healthy weight is more stable and is usually screened with BMI and waist circumference. BMI is useful, but it does not directly measure body fat.
Seniors
In older adults, preventing frailty, weakness, and unintentional weight loss can be just as important as avoiding excess body fat. Being slightly heavier than a younger adult is not always a problem if strength, function, and metabolic health are good.
A Practical Way to Use a Body Weight Chart by Age
Use the chart that matches your life stage.
- Birth to 2 years: track growth on WHO charts with a pediatric clinician.
- Ages 2 to 19: use CDC BMI-for-age percentiles, not adult BMI categories.
- Adults: use BMI plus waist size.
- Seniors: use BMI as a starting point, but also pay attention to strength, appetite, function, and unplanned weight loss.
When to Talk to a Doctor
You should ask a healthcare professional about weight if:
- your child’s growth curve changes sharply,
- you or your child fall outside the usual healthy range,
- your waist size is above the higher-risk range,
- you are an older adult losing weight without trying,
- or you have fatigue, weakness, poor appetite, or other symptoms along with weight change.
FAQ
Is there a standard body weight chart by age for adults?
No. For adults, healthy weight is usually assessed by height and BMI, not by age alone. The BMI categories stay the same for most adults age 20 and older.
What is a healthy weight for a child by age?
There is no single healthy weight number for every child of the same age. CDC uses BMI-for-age percentiles for children and teens ages 2 to 19.
Do seniors have a different healthy weight range?
Sometimes, yes. NIA and NIDDK both note that healthy weight in older adults can differ from younger adults because body composition changes with age.
Is BMI enough by itself?
No. CDC says BMI is a screening tool, not a diagnosis. For adults, it should be considered with other health factors, and for children it should be read along with growth patterns and clinical context.
Conclusion
A useful body weight chart by age is really a set of different tools for different stages of life. Babies and toddlers should be tracked on WHO growth charts, children and teens on CDC BMI-for-age percentiles, adults on BMI and waist size, and seniors with added attention to muscle, function, and unintended weight loss. Start with the right chart for your age group, then use it as a guide rather than a verdict. If weight changes suddenly or does not seem to fit the bigger health picture, get personalized advice from a qualified clinician.
This content is for informational purposes only and not medical advice.
Sources/References
- Centers for Disease Control and Prevention — Using WHO Growth Standard Charts
- Centers for Disease Control and Prevention — Summary: Using WHO Child Growth Standards
- Centers for Disease Control and Prevention — CDC Growth Charts
- Centers for Disease Control and Prevention — Child and Teen BMI Categories
- Centers for Disease Control and Prevention — About Body Mass Index (BMI)
- Centers for Disease Control and Prevention — Adult BMI Categories
- National Heart, Lung, and Blood Institute — Aim for a Healthy Weight
- National Institute on Aging — Maintaining a Healthy Weight
- National Institute of Diabetes and Digestive and Kidney Diseases — Health Tips for Older Adults
- American Academy of Pediatrics — Your Preemie’s Growth & Developmental Milestones