
For adult women, the BMI chart does not change by age. The official BMI ranges stay the same from age 20 onward: under 18.5 is underweight, 18.5 to 24.9 is healthy weight, 25.0 to 29.9 is overweight, and 30.0 or higher is obesity. For girls and teens, BMI is interpreted differently using age- and sex-specific percentiles instead of adult cutoffs. (CDC)

That difference matters because many readers expect women in their 20s, 40s, and 60s to have separate adult BMI ranges, but official guidance does not work that way. Recent National Center for Health Statistics data show the average U.S. woman age 20 and older is 63.5 inches tall, weighs 171.8 pounds, and has a 38.5-inch waist, while CDC data show 41.3% of women age 20 and older had obesity during August 2021 to August 2023. This guide explains the official adult BMI chart, how height and weight affect BMI, when age changes the chart, and where BMI has limits.
BMI Chart for Women by Age: Quick Overview
This is the simplest way to understand how BMI guidance changes by age for females:
| Age group | Best tool to use | What “healthy” means |
|---|---|---|
| Birth to 2 years | WHO growth standards | Growth is tracked with weight-for-length and other growth measures, not adult BMI categories |
| Ages 2 to 19 | BMI-for-age percentile | Healthy weight is from the 5th percentile to less than the 85th percentile |
| Age 20 and older | Adult BMI chart | Healthy weight is a BMI of 18.5 to 24.9 |
This is the key point many readers miss: adult women do not use different official BMI ranges at different ages. The age-based change happens when you move from child and teen growth charts to adult BMI categories.
What BMI means for women
According to the CDC, BMI is a screening tool that estimates weight status from height and weight. In U.S. units, the formula is BMI = weight (lb) / height (in)^2 × 703. BMI is useful because it is simple and standardized, but it is not a diagnosis and does not directly measure body fat.
The National Heart, Lung, and Blood Institute also notes that BMI does not account for muscle mass, bone density, or body composition. That means a muscular woman can have a higher BMI without having excess body fat, while an older woman can have a “normal” BMI but still have low muscle mass or a higher waist measurement.
For example, if a woman is 5’4″ and weighs 145 pounds, her BMI is about 24.9, which is at the upper end of the healthy-weight range. If a woman the same height weighs 170 pounds, her BMI is about 29.2, which falls in the overweight range. This shows why height and weight need to be interpreted together rather than looking at weight alone.
Official adult BMI chart for women
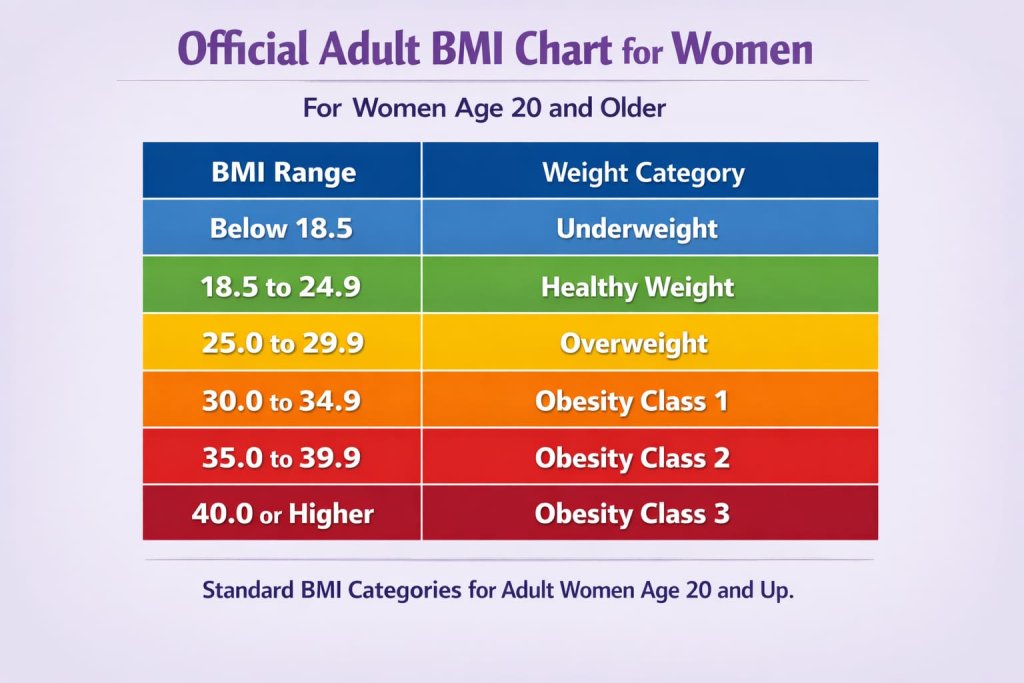
For women age 20 and older, the official adult BMI categories are the same at every adult age. (CDC)
| BMI range | Weight category |
|---|---|
| Below 18.5 | Underweight |
| 18.5 to 24.9 | Healthy weight |
| 25.0 to 29.9 | Overweight |
| 30.0 to 34.9 | Obesity Class 1 |
| 35.0 to 39.9 | Obesity Class 2 |
| 40.0 or higher | Obesity Class 3 |
These are the standard adult BMI categories used in U.S. health guidance. They apply to adult women whether you are 21, 45, or 70.
BMI chart for women by height and weight
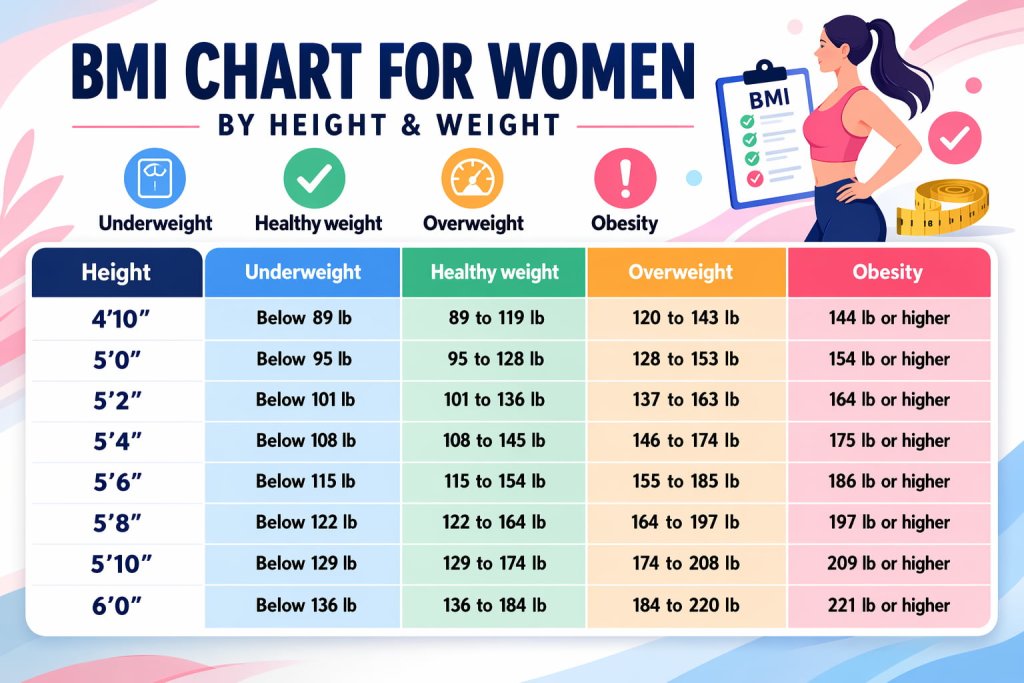
The chart below uses the CDC BMI formula and the standard adult BMI cutoffs. The numbers are rounded to the nearest pound, so they are best used as quick reference ranges rather than exact medical targets. (CDC)
| Height | Underweight | Healthy weight | Overweight | Obesity |
|---|---|---|---|---|
| 4’10” | Below 89 lb | 89 to 119 lb | 120 to 143 lb | 144 lb or higher |
| 5’0″ | Below 95 lb | 95 to 128 lb | 128 to 153 lb | 154 lb or higher |
| 5’2″ | Below 101 lb | 101 to 136 lb | 137 to 163 lb | 164 lb or higher |
| 5’4″ | Below 108 lb | 108 to 145 lb | 146 to 174 lb | 175 lb or higher |
| 5’6″ | Below 115 lb | 115 to 154 lb | 155 to 185 lb | 186 lb or higher |
| 5’8″ | Below 122 lb | 122 to 164 lb | 164 to 197 lb | 197 lb or higher |
| 5’10” | Below 129 lb | 129 to 174 lb | 174 to 208 lb | 209 lb or higher |
| 6’0″ | Below 136 lb | 136 to 184 lb | 184 to 220 lb | 221 lb or higher |
This kind of chart is helpful because weight alone does not tell you much without height. For example, 150 pounds can fall into different BMI categories depending on how tall you are. That is why BMI charts always combine height and weight, not weight by itself.
Does the BMI chart for women change by age?
For adult women, no. The CDC says adult BMI categories are based on BMI regardless of age, sex, or race.
For girls and teens ages 2 through 19, the chart does change because BMI must be interpreted using BMI-for-age percentiles. The CDC classifies children and teens as underweight below the 5th percentile, healthy weight from the 5th percentile to less than the 85th percentile, overweight from the 85th percentile to less than the 95th percentile, and obesity at or above the 95th percentile.
For birth to age 2, the CDC recommends WHO growth standards rather than adult BMI categories. In that age group, growth is typically tracked with measures such as weight-for-length, not adult BMI cutoffs.
How to use a BMI chart the right way
A BMI chart works best when you use it as a starting point, not a final judgment. Here is the practical way to use it:
- Measure your height without shoes.
- Weigh yourself under similar conditions each time.
- Calculate your BMI or find your height on a BMI chart.
- Compare your BMI with the standard adult categories.
- Look at other markers too, especially waist size, body composition, fitness, and recent weight changes.
That last step matters. The National Heart, Lung, and Blood Institute notes that a waist circumference of more than 35 inches for women increases risk for heart disease and type 2 diabetes. A woman can have a BMI near the healthy range and still have a waist size that raises health risk.
BMI for older women
For older women, the same official adult BMI ranges still apply, but BMI should be interpreted with more context. The National Institute on Aging explains that healthy weight in later life is still important, yet factors like eating habits, physical activity, strength, and unplanned weight loss also matter.
This is one reason BMI can miss important changes in aging bodies. A woman may lose muscle as she gets older without a dramatic change on the scale. That is why clinicians often look at BMI together with waist circumference, mobility, strength, and overall health rather than using BMI alone.
Pregnancy is different
If you are pregnant, a standard BMI chart is still useful as a prepregnancy starting point, but pregnancy weight goals follow different guidance. The CDC recommends weight gain ranges during pregnancy based on prepregnancy BMI. For one baby, the guidance is:
| Prepregnancy BMIRecommended weight gain | |
|---|---|
| Under 18.5 | 28 to 40 lb |
| 18.5 to 24.9 | 25 to 35 lb |
| 25.0 to 29.9 | 15 to 25 lb |
| 30.0 to 39.9 | 11 to 20 lb |
So if your search for a “BMI chart for women by age, weight, and height” is related to pregnancy, it is best to use pregnancy-specific guidance instead of a general adult BMI chart alone.
When BMI is most useful and when it is less helpful
BMI is most useful for:
- quick screening
- tracking broad weight trends over time
- comparing height and weight in a standardized way
- identifying when a closer health review may be helpful
BMI is less helpful on its own for:
- very muscular women
- older women with low muscle mass
- pregnant women
- children and teens
- anyone trying to assess health from BMI alone without considering waist size, labs, diet, fitness, or medical history
That balanced view matches official guidance: BMI is helpful, but it is only one piece of the picture.
When to talk with a healthcare professional about BMI
A BMI chart is useful for screening, but some situations deserve more than a chart alone. It is a good idea to talk with a healthcare professional if:
- your BMI falls in the underweight or obesity range
- you have gained or lost weight without trying
- your waist size is above 35 inches
- you are pregnant or recently postpartum
- you have a history of an eating disorder
- your BMI does not seem to match your body composition, fitness level, or overall health
A clinician can look at BMI together with waist circumference, blood pressure, blood sugar, cholesterol, medications, and other health factors to give a more complete picture.
FAQ
What is a healthy BMI for women?
For adult women, a healthy BMI is 18.5 to 24.9. That range does not change by adult age.
Does BMI change for women over 50 or 60?
The official adult BMI categories do not change for women over 50 or 60. What does change is how carefully BMI should be interpreted alongside muscle mass, waist circumference, strength, and unplanned weight loss.
Is BMI accurate for all women?
No. BMI is a useful screening tool, but it does not directly measure body fat and does not account for muscle, bone, or fat distribution.
Is 170 pounds healthy for a woman?
It depends on height. At 5’4″, 170 pounds is near the overweight range. At 5’10”, 170 pounds falls within the healthy range. Height is what makes the difference.
Conclusion
A BMI chart for women is most accurate when it is used in the right age group. Adult women use the same official BMI ranges at every age, while girls and teens use age-specific percentile charts. Use height and weight together, not weight alone, and remember that waist size, muscle mass, pregnancy, and age-related body changes can all add important context. If you want the most useful result, treat BMI as a screening tool and pair it with a fuller view of your health.
Sources and References
- CDC — BMI Frequently Asked Questions
- CDC — Adult BMI Categories
- CDC — Calculating BMI
- CDC — Child and Teen BMI Categories
- National Heart, Lung, and Blood Institute — Calculate Your BMI
- National Heart, Lung, and Blood Institute — Aim for a Healthy Weight
- National Institute on Aging — Maintaining a Healthy Weight
- CDC — Obesity and Severe Obesity Prevalence in Adults: United States, August 2021–August 2023