

There is no single official ideal body weight chart by age for everyone. Healthy weight is measured differently for infants, children, adults, and seniors, which is why the most accurate approach is to use the right chart for your life stage rather than look for one universal number. The main tools are growth standards for babies, BMI-for-age percentiles for children and teens, adult BMI ranges for adults, and extra muscle, waist, and weight-change context for older adults. CDC recommends exactly that life-stage approach, and it also notes that BMI is a screening tool rather than a diagnosis by itself.
Understanding this matters because a “healthy” weight is not just about the scale. In children, growth and development matter. In adults, height changes the healthy range. In seniors, muscle loss, waist size, and unintentional weight loss can matter as much as body weight alone.
Ideal Body Weight Chart by Age: Quick Overview
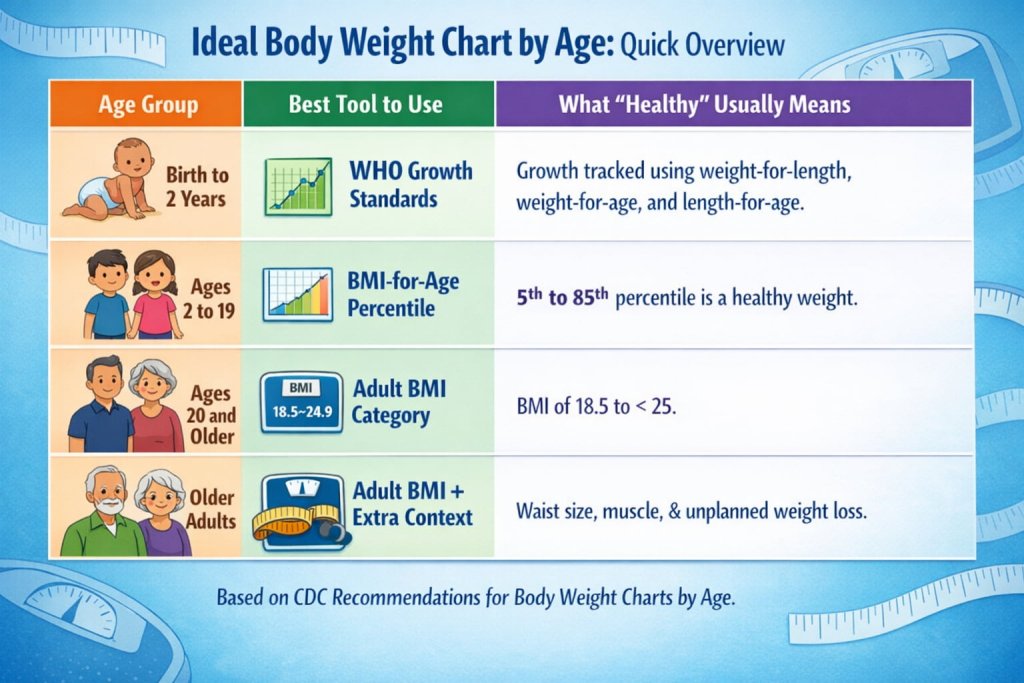
Here is the most useful way to think about an ideal body weight chart by age.
| Age group | Best tool to use | What “healthy” usually means |
|---|---|---|
| Birth to 2 years | WHO growth standards | Growth is tracked over time using weight-for-length, weight-for-age, and length-for-age |
| Ages 2 to 19 | BMI-for-age percentile | Healthy weight is from the 5th percentile to less than the 85th percentile |
| Ages 20 and older | Adult BMI category | Healthy weight is a BMI of 18.5 to less than 25 |
| Older adults | Adult BMI plus extra context | Waist size, muscle, strength, and unplanned weight loss also matter |
This overview matches current CDC recommendations for which charts to use at different ages.
Why There Is No One-Size-Fits-All Ideal Weight by Age
An age-only chart sounds simple, but it is not how healthy weight is assessed in real clinical practice. A 10-year-old child, a 35-year-old adult, and a 75-year-old senior may all have the same body weight, but that number means very different things depending on height, sex, body composition, and stage of life. CDC Growth Charts explains that growth charts and BMI are screening tools that help build an overall health picture, not stand-alone diagnoses.
That is why the best “ideal body weight chart by age” is really a set of age-specific tools. It is more accurate, more useful, and much less misleading than a single pounds-by-age table.
Ideal Body Weight Chart by Age for Infants and Toddlers (Birth to 2 Years)
For babies and toddlers, the right reference is not an adult-style BMI chart. CDC recommends the WHO Child Growth Standards for children from birth to age 2, then transitioning to CDC growth charts at age 2.
Important note: Even though the WHO standards include a BMI chart beginning at birth, CDC does not recommend BMI-for-age for children younger than 2. For this age group, weight-for-length is the preferred screening tool, and providers switch to CDC BMI-for-age charts at age 2. Because the chart, measurement method, and cutoff values change at that point, a percentile shift during the transition does not automatically mean a child’s health suddenly changed.
What clinicians track under age 2
| Measure | Why it matters |
|---|---|
| Weight-for-length | Helps show whether weight is low or high for a child’s length |
| Weight-for-age | Helps track overall growth pattern over time |
| Length-for-age | Helps show linear growth over time |
CDC notes that for children younger than 2, low weight-for-length is below the 2nd percentile and high weight-for-length is above the 98th percentile. That is one reason a simple “ideal pounds by age” chart can be misleading in this age group.
What parents should remember
A healthy number for a baby is not just one weight. What matters most is steady growth over time on the correct chart, not comparing one child’s weight with another child of the same age.
Healthy Weight Ranges for Children and Teens (Ages 2 to 19)
For children and teens, healthy weight is assessed with BMI-for-age percentile, not with a single target weight. The chart must match both age and sex, because body composition changes as children grow. CDC Child and Teen BMI Categories gives the following ranges for ages 2 through 19.
Child and teen healthy weight chart
| BMI-for-age category | Percentile range |
|---|---|
| Underweight | Less than the 5th percentile |
| Healthy weight | 5th percentile to less than the 85th percentile |
| Overweight | 85th percentile to less than the 95th percentile |
| Obesity | 95th percentile or greater |
| Severe obesity | 120% of the 95th percentile or greater, or BMI 35 kg/m² or greater |
These categories are used as screening ranges. Providers also look at growth trend, health history, and physical development.
Why children do not have one “ideal weight” number
A child who is tall for age and a child who is short for age should not have the same target weight. Puberty also changes weight, height, and body composition at different times. That is why BMI-for-age percentiles are much more useful than age-only weight charts for school-age kids and teens.
Ideal Body Weight Chart by Age for Adults (Age 20 and Older)
For adults, the standard healthy-weight tool is BMI, which compares weight with height. CDC Adult BMI Categories defines the adult ranges this way.
Adult healthy weight chart
| BMI category | BMI range |
|---|---|
| Underweight | Less than 18.5 |
| Healthy weight | 18.5 to less than 25 |
| Overweight | 25 to less than 30 |
| Obesity | 30 or greater |
This adult framework applies to adults age 20 and older. It is not a separate chart for each age decade.
Pregnancy is an exception. During pregnancy, the standard adult healthy-weight chart is not the right target to use. CDC pregnancy weight guidance bases pregnancy weight-gain recommendations on prepregnancy BMI, with different ranges depending on whether you started pregnancy underweight, at a normal weight, overweight, or with obesity.
Sample adult healthy weight ranges by height
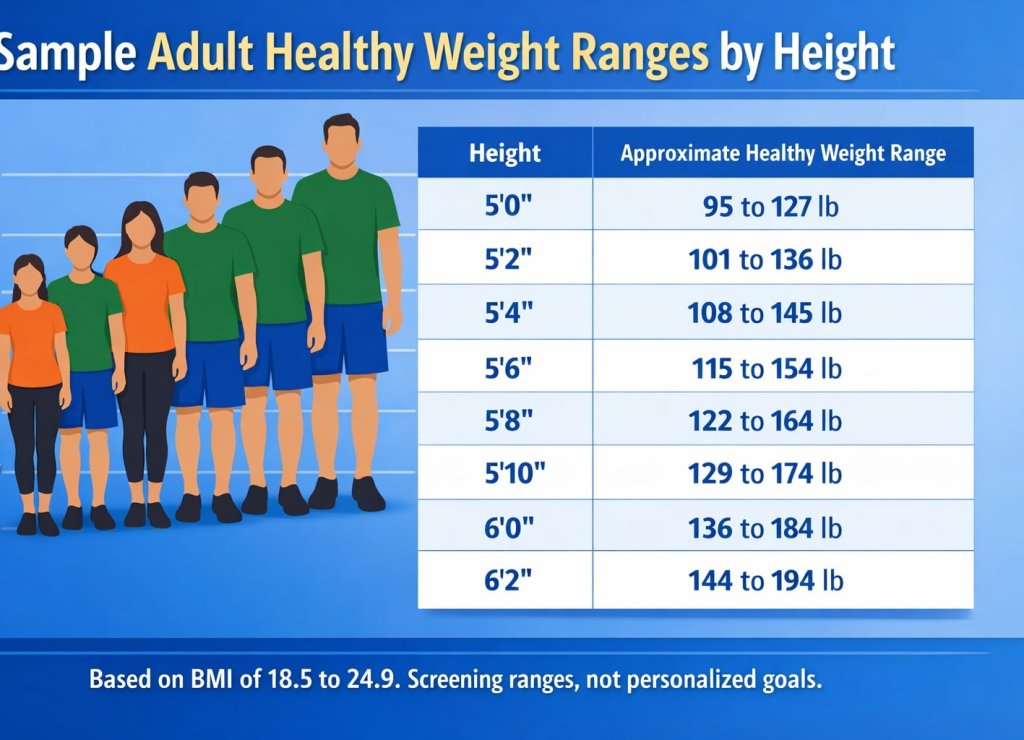
Because many readers want a practical chart, the table below shows approximate healthy weight ranges based on a BMI of 18.5 to 24.9, which is the current adult healthy-weight range.
| Height | Approximate healthy weight range |
|---|---|
| 5’0″ | 95 to 127 lb |
| 5’2″ | 101 to 136 lb |
| 5’4″ | 108 to 145 lb |
| 5’6″ | 115 to 154 lb |
| 5’8″ | 122 to 164 lb |
| 5’10” | 129 to 174 lb |
| 6’0″ | 136 to 184 lb |
| 6’2″ | 144 to 194 lb |
These ranges are a useful shortcut, but they are still screening ranges, not personalized goals. They are based on the adult healthy BMI range and the BMI height-and-weight approach used by NHLBI.
BMI Has Important Limits
BMI is useful for screening, but it does not directly measure body fat. CDC’s BMI FAQ explains that BMI cannot distinguish fat from muscle and bone, and it does not show where body fat is carried. That means some adults, including athletes or people with higher muscle mass, may fall into the overweight or obesity range by BMI alone even when the chart does not reflect their full health picture.
Healthy Weight for Seniors: What Changes With Age?
Older adults do not have a separate official CDC senior BMI chart, but weight should be interpreted more carefully in later life. MedlinePlus notes that in older adults, keeping muscle and strength is key, and sudden weight loss should be checked by a healthcare provider. It also explains that body weight needs can differ at different ages.
A more useful senior weight checklist
| What to check | Why it matters |
|---|---|
| BMI category | Still a helpful screening starting point |
| Waist circumference | Helps show belly-fat-related risk |
| Muscle and strength | Low muscle can be missed by the scale |
| Unintentional weight loss | Can signal a health problem |
Waist size is especially useful here. CDC Healthy Weight says health risk is higher when waist circumference is more than 35 inches in women or more than 40 inches in men.
Unplanned weight loss deserves attention at any adult age, but especially in seniors. MedlinePlus guidance on unintentional weight loss says losing 10 pounds or 5% of usual body weight within 6 to 12 months without trying should be checked.
Why BMI alone can miss the full picture in seniors
With aging, lean body mass tends to decrease, and muscle tissue can be lost over time. That means an older adult can look “normal” by BMI while still having low muscle mass or reduced strength. This is why weight, waist size, strength, appetite, and day-to-day function all matter in a senior health review. MedlinePlus on aging changes in body shape helps explain that age-related body composition changes are common.
BMI, Waist Size, and Health Markers All Matter
BMI is useful because it is quick and standardized, but it should be considered with other factors such as blood pressure, cholesterol, and physical examination. In other words, the chart is a starting point, not the final answer.
That is also why two people with the same BMI may not have the same health profile. Waist size, fitness, muscle mass, medications, and medical history can all change what a healthy weight looks like in real life.
How to Use an Ideal Body Weight Chart by Age Correctly
For children
Use the correct growth chart for your child’s age, and focus on percentiles and growth trend, not one target number on the scale. CDC recommends WHO standards under age 2 and CDC charts from age 2 onward.
For adults
Start with BMI, then check waist size and your overall health picture. NHLBI healthy weight guidance notes that even a 5% to 10% reduction in initial body weight over about 6 months can improve health markers, and even 3% to 5% can help lower triglycerides and blood glucose in some adults.
For seniors
Do not focus on the scale alone. Pay attention to strength, appetite, mobility, and any unplanned weight loss. Those are often just as important as the number itself.
Common Questions About an Ideal Body Weight Chart by Age
Is there an official ideal body weight chart by age?
No. The official approach is age-specific: WHO standards for birth to 2 years, CDC BMI-for-age charts for ages 2 to 19, and adult BMI categories for adults.
What is a healthy weight for a child?
For most children and teens, healthy weight means a BMI-for-age from the 5th percentile to less than the 85th percentile on the correct chart.
Do adults have a healthy weight range?
Yes. For adults, the standard healthy range is a BMI of 18.5 to less than 25. A height-and-weight table can help translate that into an approximate pound range.
Is healthy weight different for seniors?
There is no separate official senior BMI chart, but healthy weight assessment in older adults should also consider waist size, muscle, strength, and unexplained weight loss.
When to Talk With a Healthcare Professional About Weight
A chart is most useful when it leads to the right next step. Consider getting medical advice in these situations:
- For a child or teen: if the growth pattern changes noticeably over time, or you have concerns about appetite, puberty, or overall growth. CDC notes that growth monitoring should be based on a series of accurate measurements over time, and changes in percentile classification should be interpreted with caution.
- For an adult or senior: if weight changes without trying. MedlinePlus says unexplained weight loss of more than 10 pounds or 5% of usual body weight within 6 to 12 months should be checked.
Bottom Line
The best ideal body weight chart by age is not one chart. It is the right chart for the right age group. Babies and toddlers need growth standards. Children and teens need BMI-for-age percentiles. Adults need BMI and height-based ranges. Seniors need those tools plus extra attention to waist size, muscle, and unexpected weight loss. Use the chart as a guide, then match it with the bigger health picture.
If you want the most accurate answer for yourself or your child, use the proper age-based chart and ask a healthcare professional to interpret it in context.
Sources/References
- CDC — What Growth Charts Are Recommended?
- CDC — Using WHO Growth Standard Charts
- CDC — CDC Growth Charts
- CDC — Child and Teen BMI Categories
- CDC — Adult BMI Categories
- CDC — BMI Frequently Asked Questions
- CDC — Pregnancy Weight Gain
- CDC — Healthy Weight
- NHLBI — BMI Table
- NHLBI — Aim for a Healthy Weight
- MedlinePlus — Body Weight
- MedlinePlus — Weight Loss – Unintentional
- MedlinePlus — Aging Changes in Body Shape