
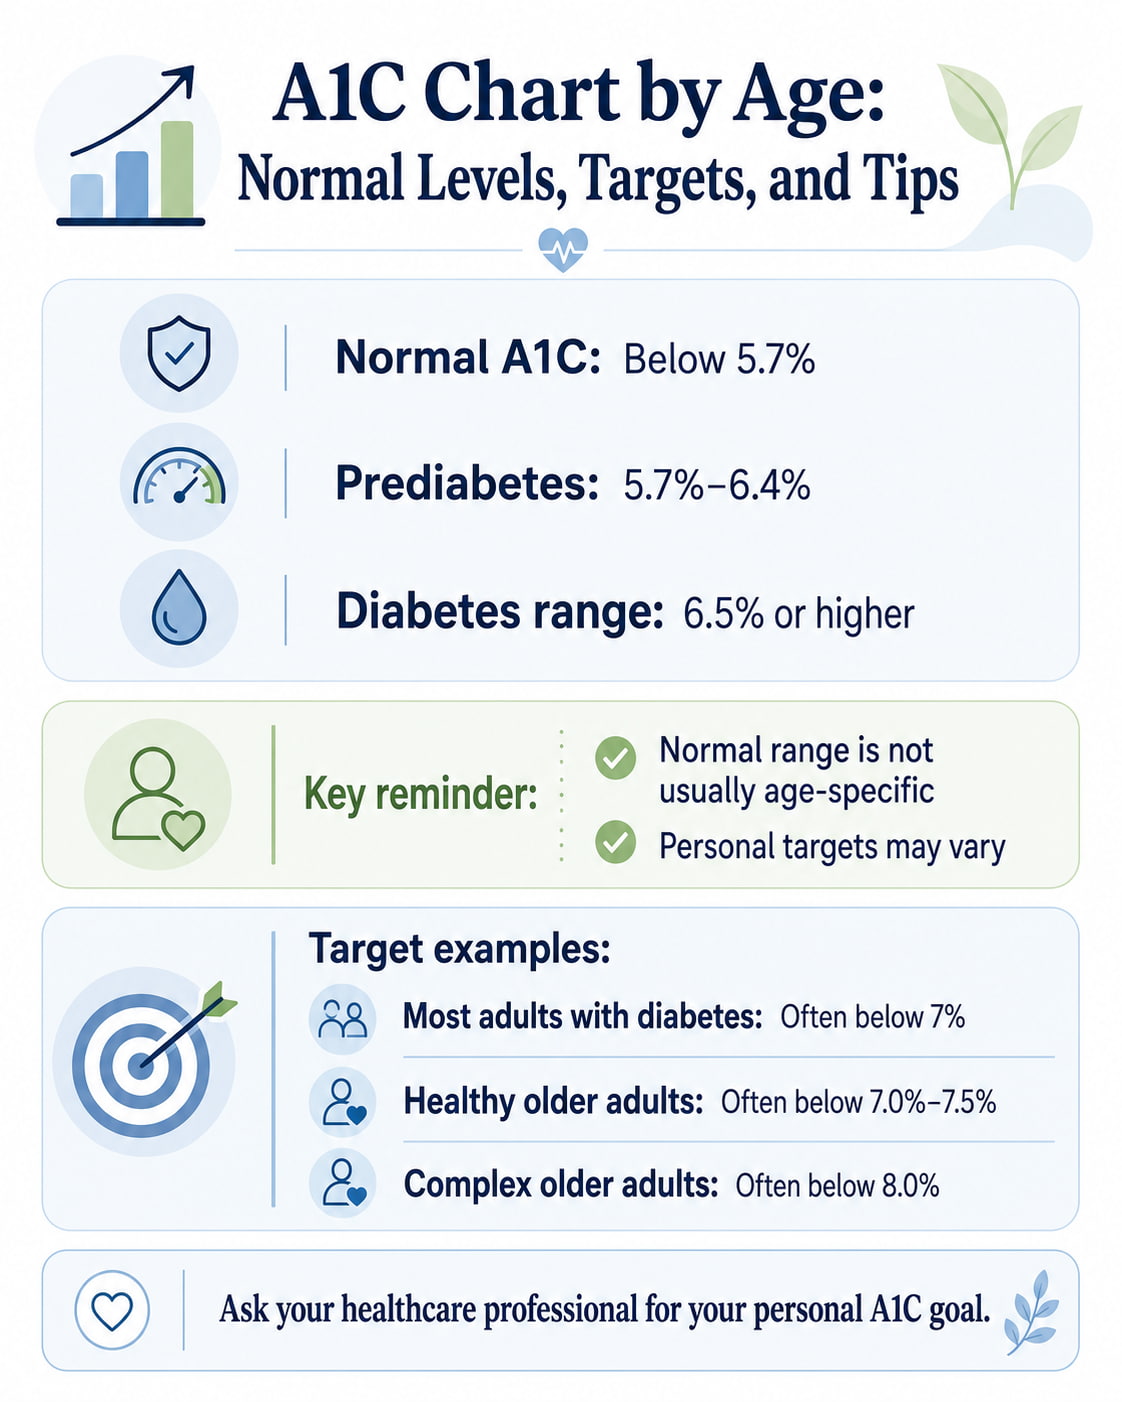
A normal A1C is below 5.7% for adults of any age, but personal A1C targets can change based on age, diabetes status, pregnancy, overall health, and risk of low blood sugar. An A1C chart by age can help you understand what your result may mean, but your healthcare professional should set your personal goal.
The CDC uses the same basic A1C diagnostic ranges for most adults: below 5.7% is normal, 5.7% to 6.4% is prediabetes, and 6.5% or higher is in the diabetes range. The important difference is this: “normal levels” are not usually age-specific, but “safe targets” often are.
What Is an A1C Test?
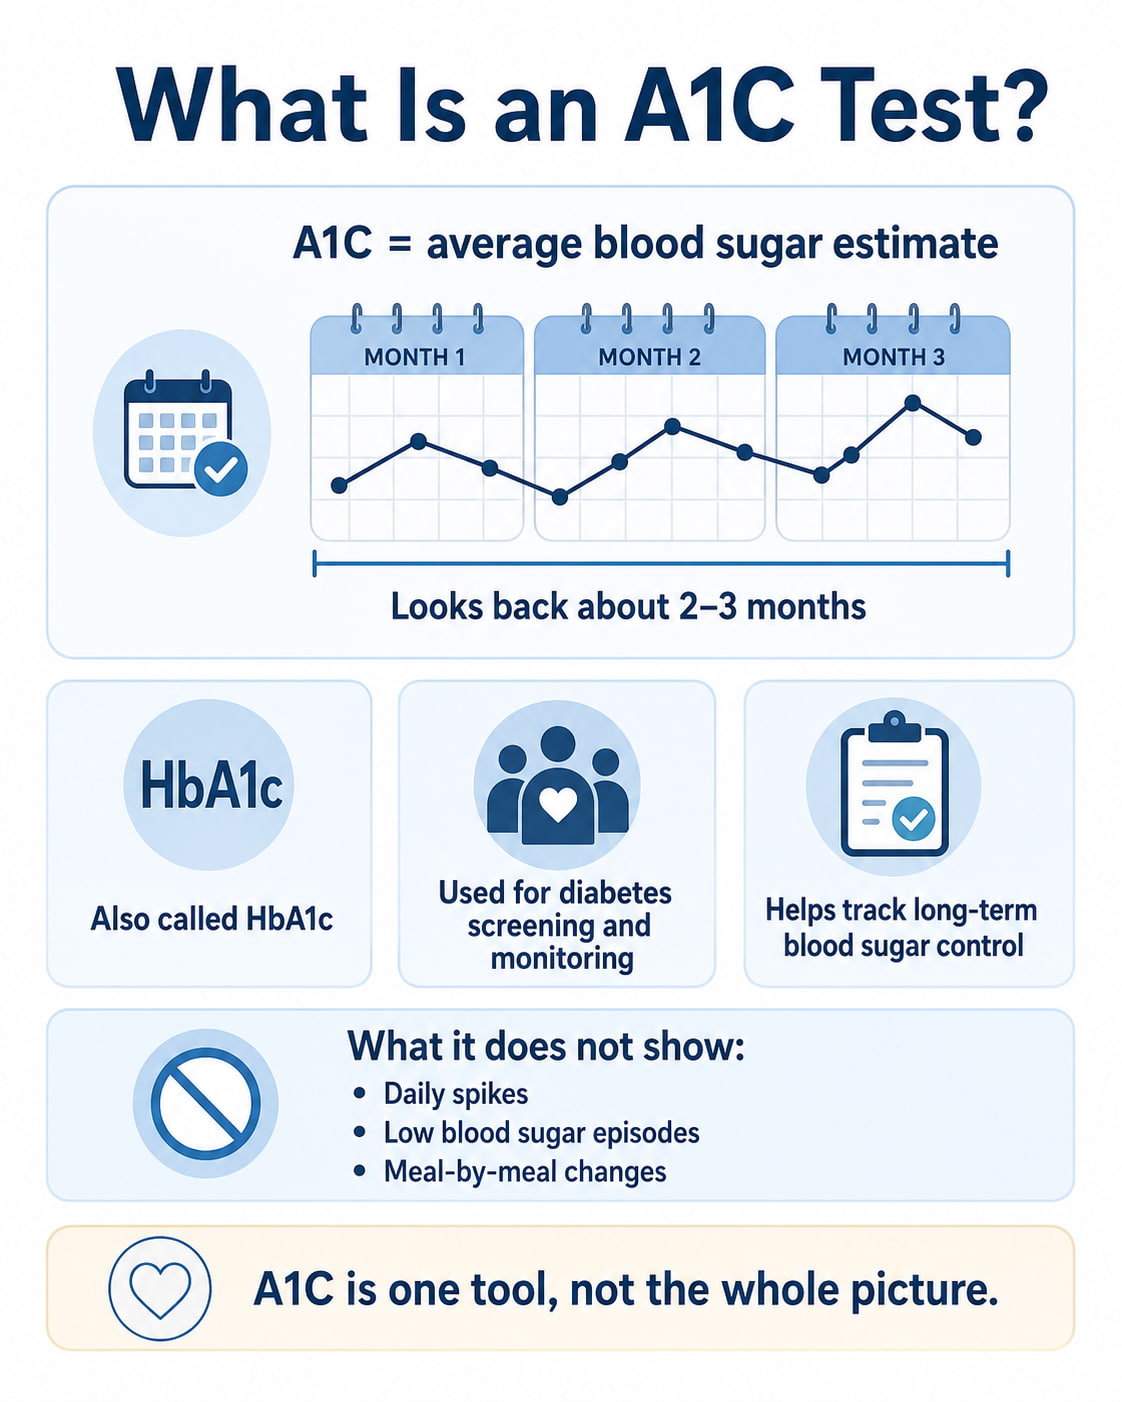
The A1C test, also called hemoglobin A1C, HbA1c, glycated hemoglobin, or glycohemoglobin, is a blood test that estimates your average blood sugar over about the past 2 to 3 months.
It measures how much glucose is attached to hemoglobin, the protein in red blood cells that carries oxygen. When blood sugar is higher over time, more glucose attaches to hemoglobin, and the A1C percentage rises. According to the NIDDK, A1C is used to help diagnose type 2 diabetes and prediabetes and to monitor diabetes management after diagnosis.
A1C is useful because it gives a longer-term picture. However, it does not show daily blood sugar spikes, lows, or how your blood sugar responds to specific meals, exercise, stress, or medication changes.
A1C Chart by Age: Normal Levels and Targets
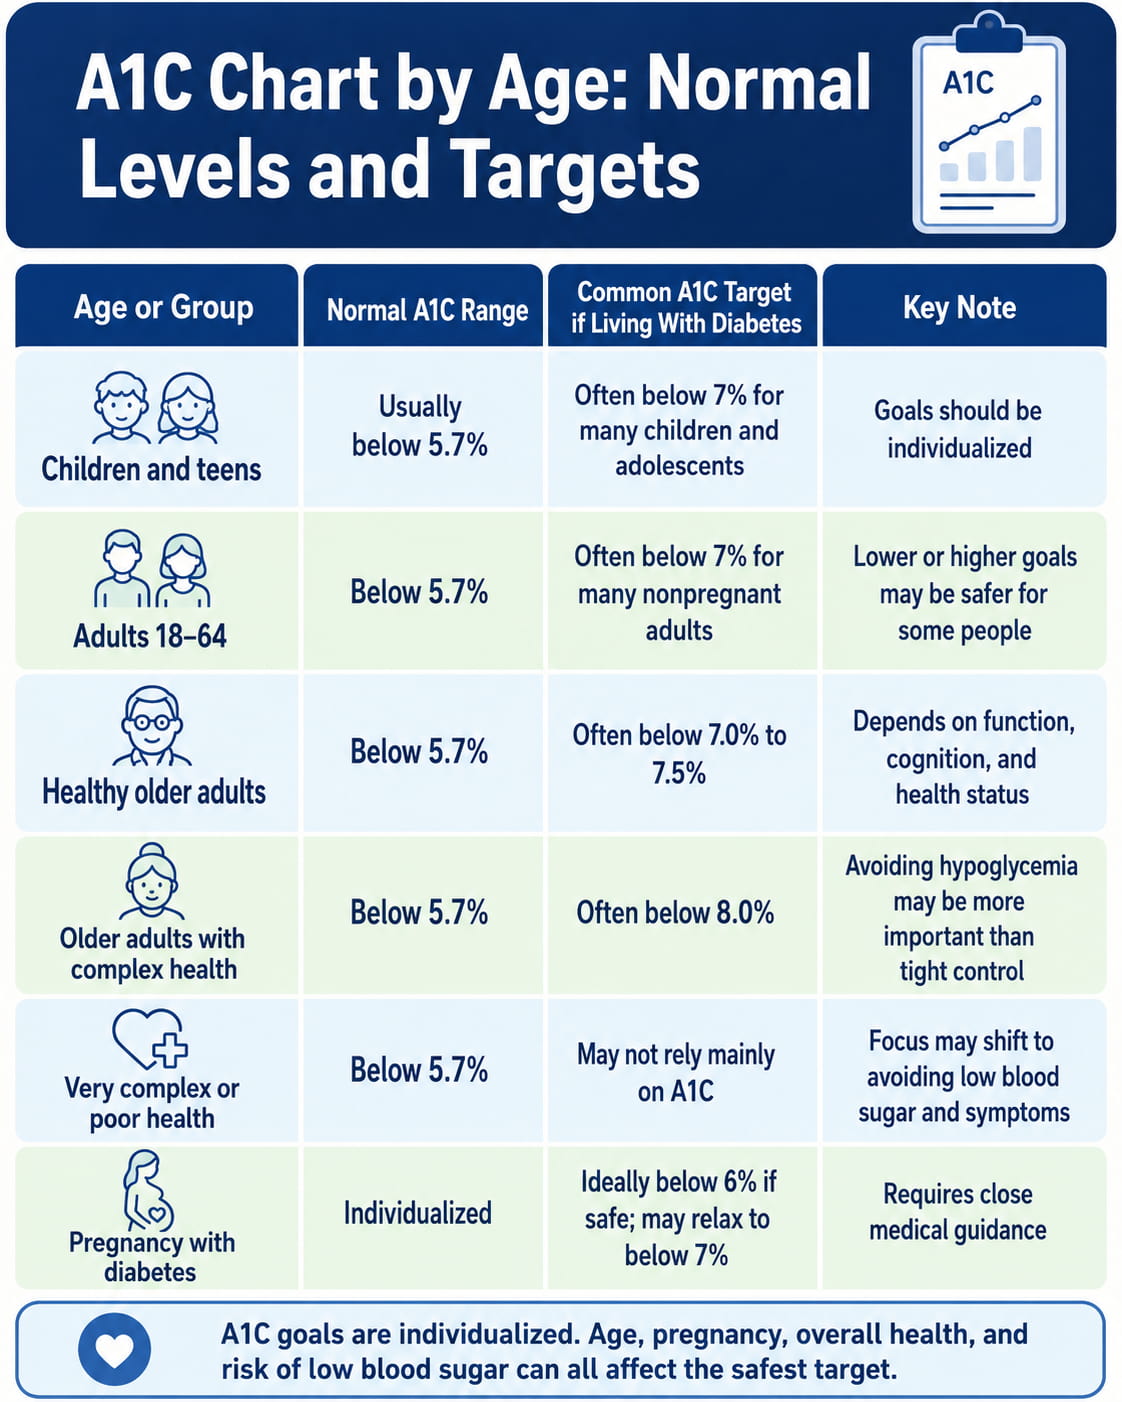
The most important thing to know is that diagnostic A1C ranges are generally the same for adults of all ages. A healthy 30-year-old and a healthy 70-year-old usually use the same “normal” A1C cutoff: below 5.7%.
However, A1C targets for people who already have diabetes may be different. Children, most adults, older adults, and pregnant people may have different goals depending on safety and medical history.
| Age or Group | Normal A1C Range | Common A1C Target if Living With Diabetes | Key Note |
|---|---|---|---|
| Children and teens | Usually below 5.7% | Often below 7% for many children and adolescents | Goals should be individualized |
| Adults 18–64 | Below 5.7% | Often below 7% for many nonpregnant adults | Lower or higher goals may be safer for some people |
| Healthy older adults | Below 5.7% | Often below 7.0% to 7.5% | Depends on function, cognition, and health status |
| Older adults with complex health | Below 5.7% | Often below 8.0% | Avoiding hypoglycemia may be more important than tight control |
| Very complex or poor health | Below 5.7% | May not rely mainly on A1C | Focus may shift to avoiding low blood sugar and symptoms |
| Pregnancy with diabetes | Individualized | Ideally below 6% if safe; may relax to below 7% | Requires close medical guidance |
The American Diabetes Association’s 2026 Standards of Care emphasize individual goals. For many nonpregnant adults with diabetes, an A1C goal below 7% is commonly recommended when it can be reached safely. More or less strict goals may be appropriate based on age, life expectancy, diabetes duration, complications, and hypoglycemia risk.
Standard A1C Levels Chart
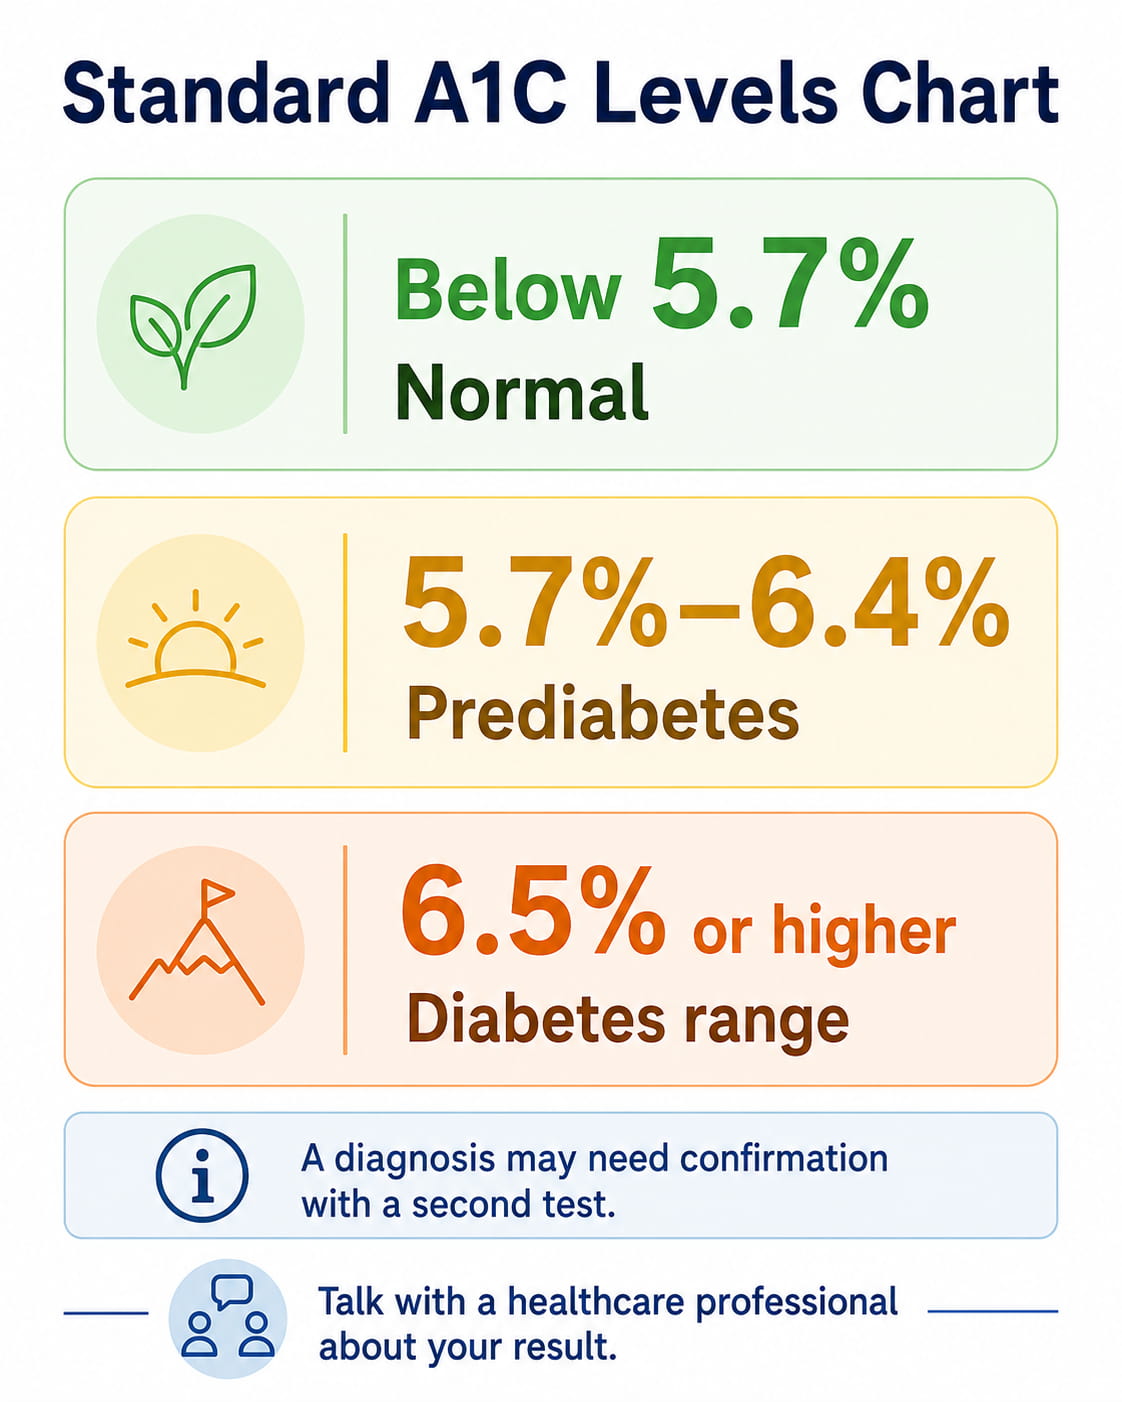
Use this chart to understand the basic diagnostic categories.
| A1C Result | What It Usually Means |
|---|---|
| Below 5.7% | Normal |
| 5.7% to 6.4% | Prediabetes |
| 6.5% or higher | Diabetes range |
An A1C of 6.5% or higher does not always mean a diagnosis is made from one test alone. The NIDDK notes that diagnosis often requires confirmation with a second test unless clear symptoms of diabetes are present. It also says point-of-care A1C tests done in a clinic or office should not be used for diagnosis; diagnosis should use a lab method certified by NGSP.
A1C Chart by Age for Adults
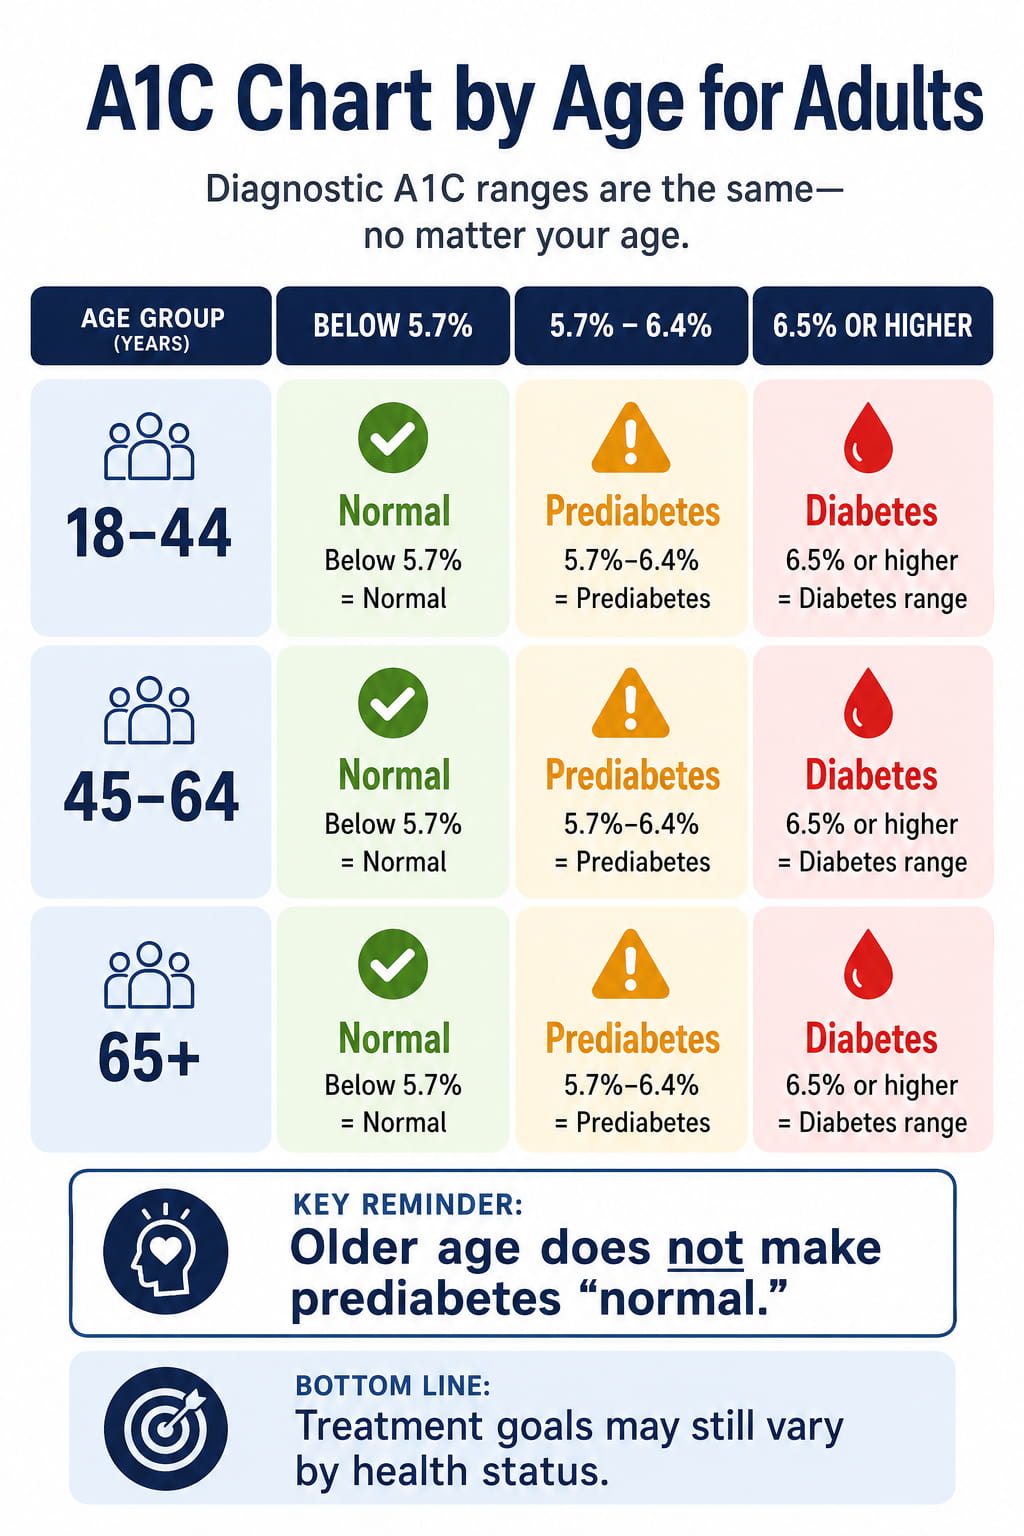
For adults, the “normal” A1C range does not automatically rise just because someone gets older. A1C below 5.7% is still considered normal.
Where age matters most is target-setting for people who already have diabetes.
| Adult Age Group | A1C Below 5.7% | A1C 5.7%–6.4% | A1C 6.5% or Higher |
|---|---|---|---|
| 18–44 | Normal | Prediabetes range | Diabetes range |
| 45–64 | Normal | Prediabetes range | Diabetes range |
| 65+ | Normal | Prediabetes range | Diabetes range |
This is why a 68-year-old with an A1C of 6.1% is not automatically “normal for age.” It is still in the prediabetes range. But if an older adult already has diabetes, their treatment goal may be less strict than a younger adult’s goal if tight control would increase the risk of low blood sugar, falls, medication burden, or poor quality of life.
A1C Targets for Children and Teens
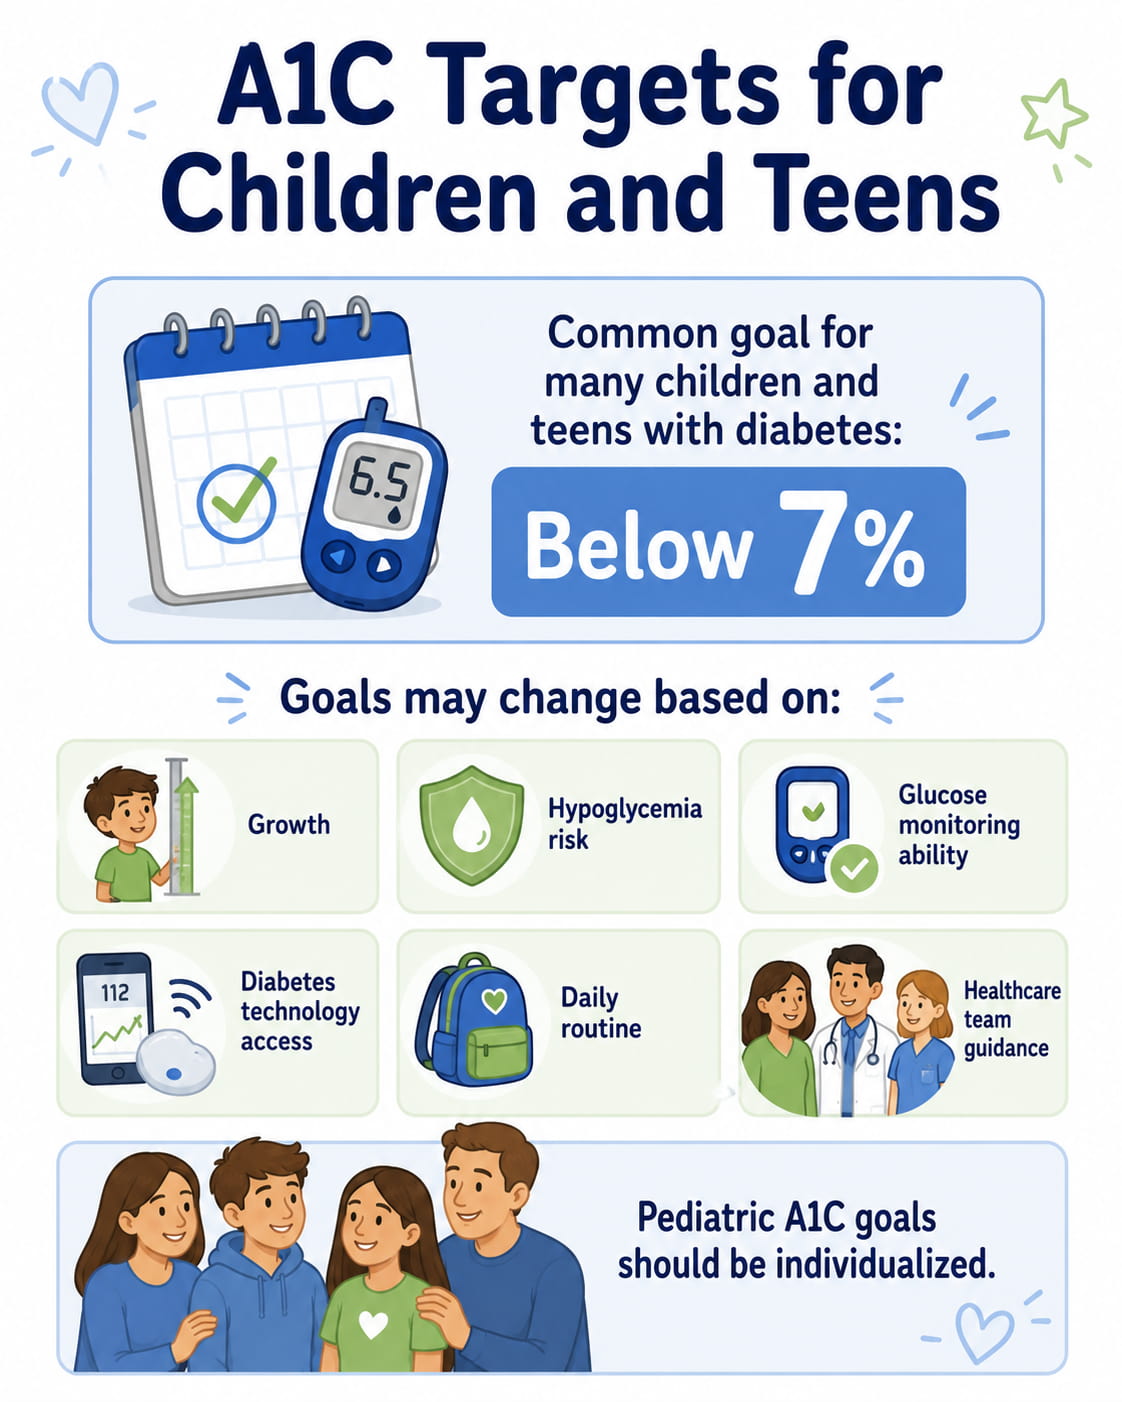
For many children and adolescents with diabetes, the ADA 2026 Standards of Care says an A1C goal below 7% is appropriate. However, the goal should be reassessed over time and adjusted for safety, growth, diabetes type, access to diabetes technology, ability to monitor glucose, and risk of hypoglycemia.
Some children and teens may need a less strict goal, such as below 7.5% or below 8%, especially if they have severe hypoglycemia, hypoglycemia unawareness, limited life expectancy, or major barriers to safe glucose monitoring.
Why Children Need Individualized A1C Goals
Children are still growing. Their eating patterns, activity, hormones, school schedule, sleep, and ability to manage diabetes can change quickly. That is why pediatric diabetes care should be guided by a healthcare team, not only by a simple chart.
A1C Targets for Most Nonpregnant Adults
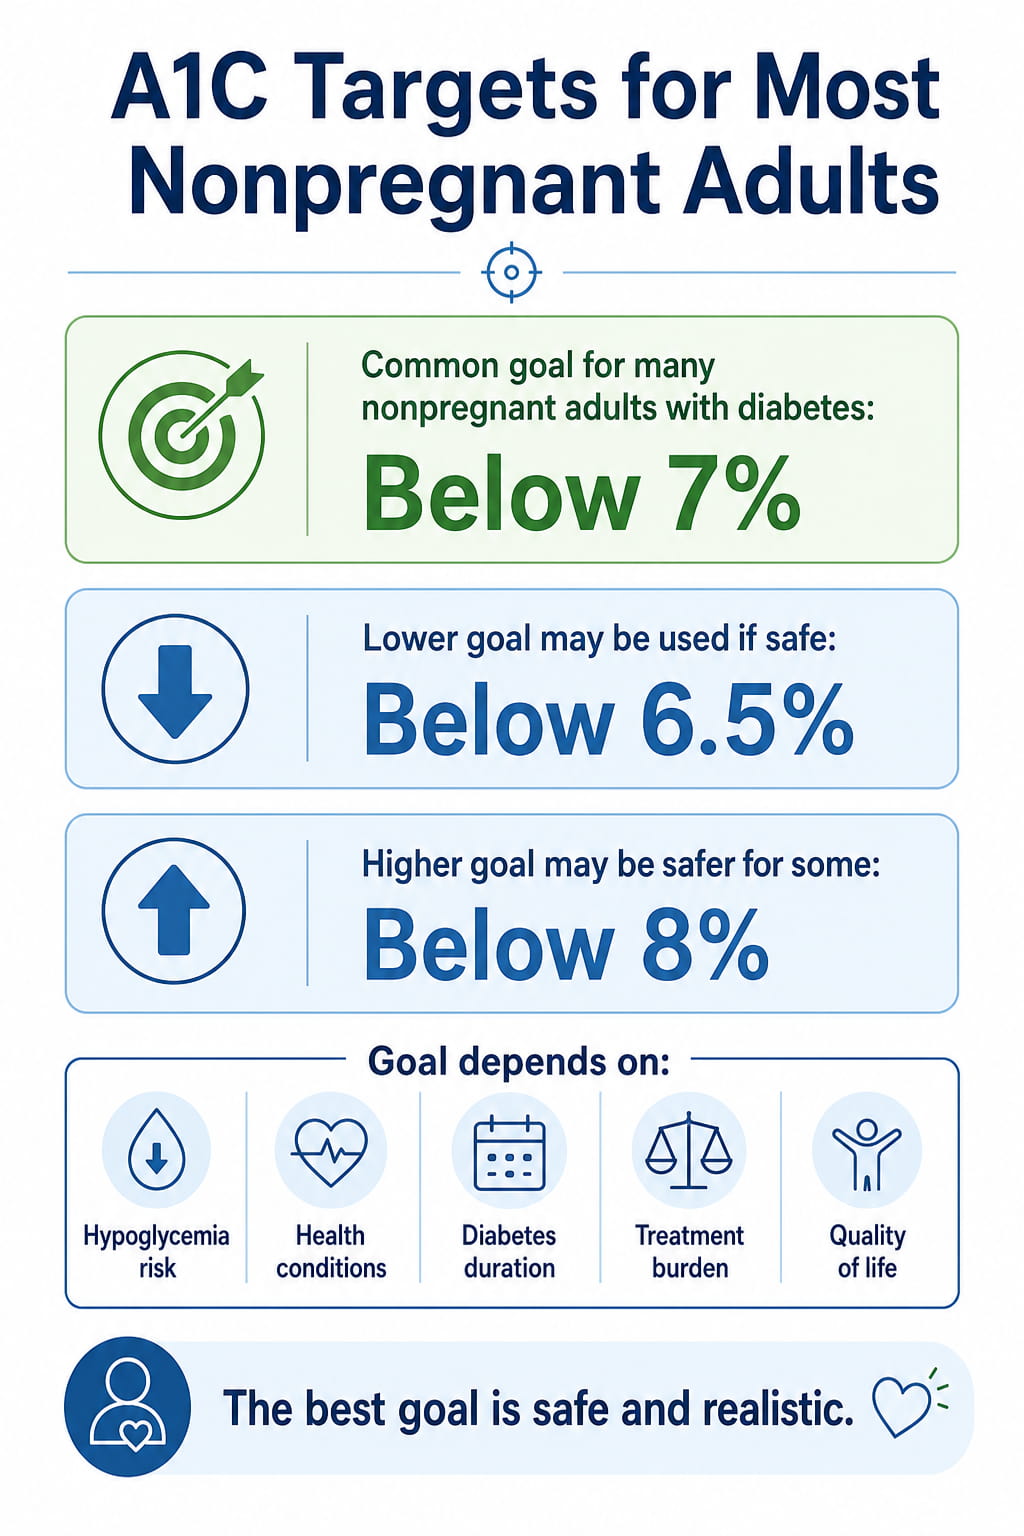
For many nonpregnant adults with diabetes, a common A1C goal is below 7%. This target is often used because it can help reduce the risk of diabetes-related complications when reached safely.
However, not everyone should aim for the same number. Some adults may have a lower goal, such as below 6.5%, if it can be achieved without significant hypoglycemia or treatment burden. Others may have a higher goal, such as below 8%, if they have a history of severe low blood sugar, advanced complications, multiple chronic conditions, limited life expectancy, or difficulty managing a complex treatment plan.
Simple Adult A1C Target Guide
| Adult Situation | Possible A1C Goal |
|---|---|
| Many nonpregnant adults with diabetes | Below 7% |
| Selected adults who can reach it safely | Below 6.5% |
| Adults with high hypoglycemia risk or major health concerns | Below 8% may be safer |
The right goal is not always the lowest possible number. The safest goal is the one that supports long-term health without causing dangerous lows or making treatment too hard to follow.
A1C Targets for Older Adults
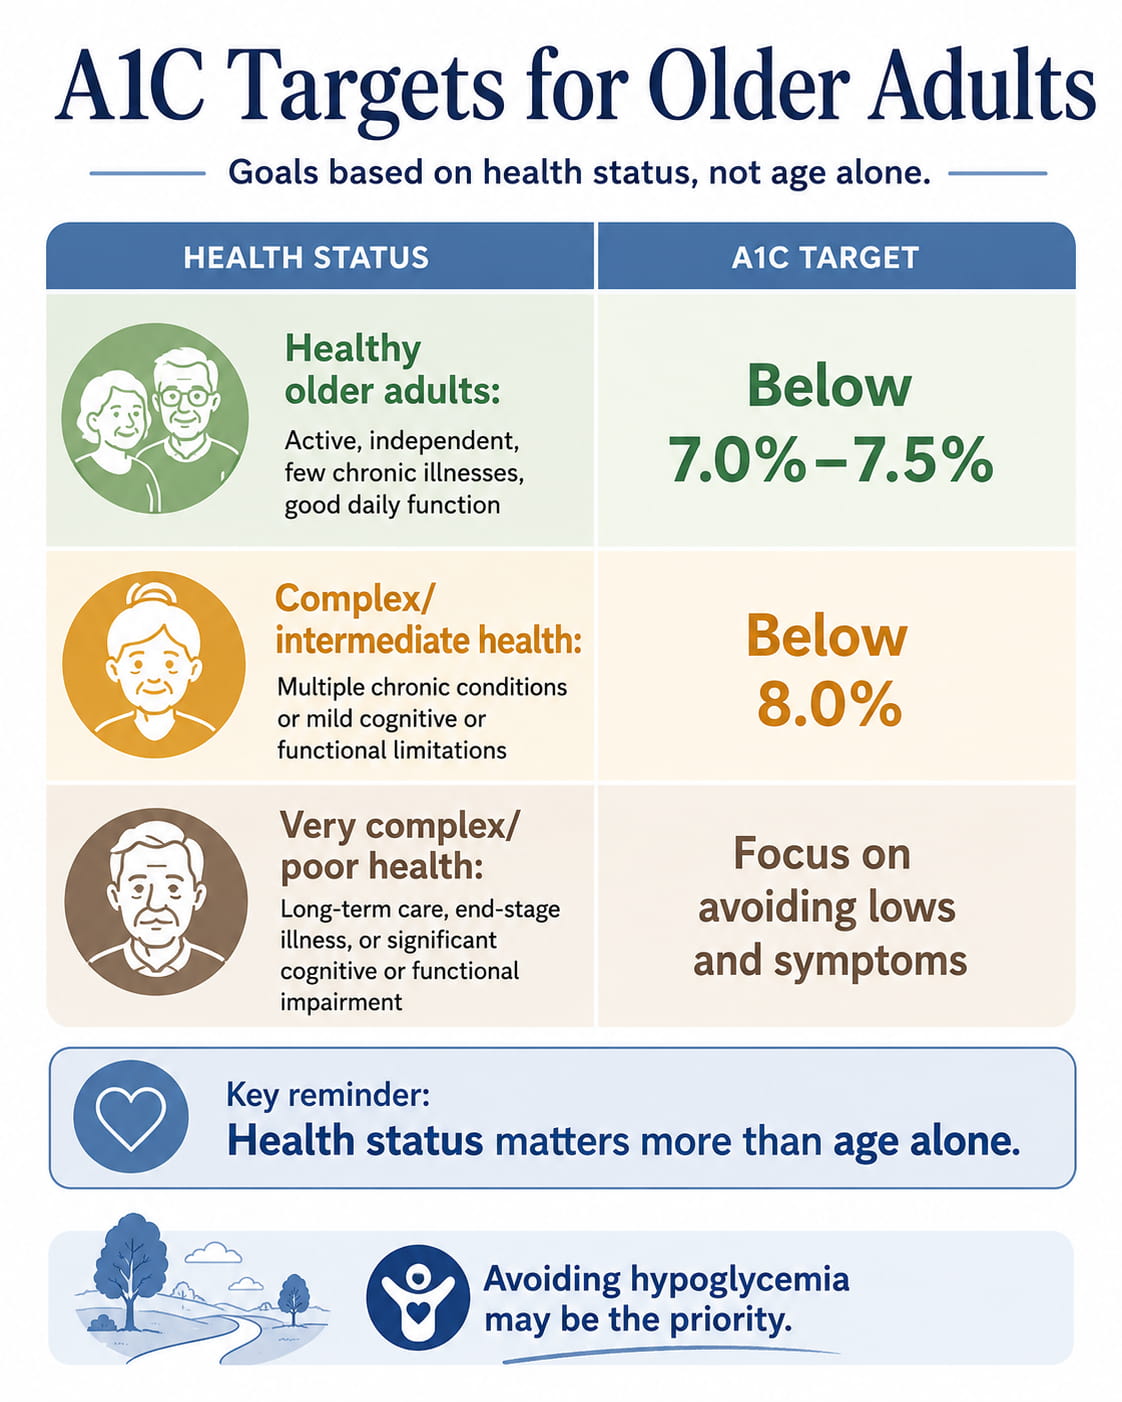
Older adults need special attention because health status varies widely. A healthy, active 68-year-old may have a different A1C goal than an 85-year-old in long-term care or someone with memory changes, kidney disease, heart disease, or frequent low blood sugar.
The ADA 2026 Standards of Care gives older-adult A1C goals based on health status rather than age alone. Healthy older adults may have a reasonable goal below 7.0% to 7.5%, while older adults with more complex health may have a less strict goal such as below 8.0%. For very complex or poor health, clinicians may focus less on A1C and more on avoiding hypoglycemia and symptomatic high blood sugar.
| Older Adult Health Status | Reasonable A1C Goal |
|---|---|
| Healthy, few chronic illnesses, good function and cognition | Below 7.0% to 7.5% |
| Complex or intermediate health | Below 8.0% |
| Very complex or poor health | Avoid relying mainly on A1C; focus on safety and symptoms |
What Is a Good A1C for a 70-Year-Old?
A good A1C for a 70-year-old depends on overall health. A healthy 70-year-old with good function may have a goal near below 7.0% to 7.5%. A 70-year-old with multiple chronic conditions, cognitive impairment, or high hypoglycemia risk may have a safer goal closer to below 8.0%.
This is why it is not accurate to say one A1C number is best for all seniors.
A1C During Pregnancy
Pregnancy is a special case. A1C may be slightly lower during pregnancy because red blood cells turn over faster. For people with diabetes during pregnancy, the ADA 2026 Standards of Care says the ideal A1C goal is below 6% if it can be achieved without significant hypoglycemia. The goal may be relaxed to below 7% when needed to prevent low blood sugar.
A1C is not the main test used to diagnose gestational diabetes. The NIDDK says gestational diabetes is usually checked with a glucose challenge test or oral glucose tolerance test between 24 and 28 weeks of pregnancy.
Pregnancy Safety Note
If you are pregnant, planning pregnancy, or recently had gestational diabetes, do not use a general A1C chart to make decisions on your own. Ask your obstetrician, endocrinologist, or diabetes care team what glucose and A1C targets are safest for you.
A1C to Average Blood Sugar Chart
Many people understand glucose meter readings better than A1C percentages. The chart below shows how A1C roughly connects to estimated average glucose, also called eAG.
| A1C | Estimated Average Glucose |
|---|---|
| 6% | 126 mg/dL |
| 7% | 154 mg/dL |
| 8% | 183 mg/dL |
| 9% | 212 mg/dL |
| 10% | 240 mg/dL |
| 11% | 269 mg/dL |
| 12% | 298 mg/dL |
The CDC explains that A1C can estimate average blood sugar, but it may not show spikes or lows. That means two people with the same A1C can still have different daily glucose patterns.
How to Read Your A1C Result
Here are simple examples:
- A1C 5.3%: Usually in the normal range.
- A1C 5.9%: In the prediabetes range.
- A1C 6.5%: In the diabetes range, but diagnosis may need confirmation.
- A1C 7.2%: May be close to target for some people with diabetes but above target for others.
- A1C 8.0%: May be a reasonable goal for some older adults or people with complex health, but too high for others.
- A1C above 9%: Often suggests blood sugar has been running high and should be reviewed with a healthcare professional.
Your A1C result should always be interpreted with your full health picture, including daily glucose readings, medications, symptoms, age, pregnancy status, kidney health, anemia history, and risk of low blood sugar.
Why A1C Matters More With Age
Age does not change the diagnostic cutoffs, but diabetes risk increases with age. CDC data released in 2026 estimated that 40.1 million people in the United States had diagnosed or undiagnosed diabetes in 2023, and 115.2 million U.S. adults had prediabetes.
NHANES data from August 2021 through August 2023 also found that diabetes prevalence increased with age: 3.6% among adults ages 20–39, 17.7% among adults ages 40–59, and 27.3% among adults age 60 and older.
That makes A1C screening important, especially for adults with risk factors such as family history, overweight, physical inactivity, a history of gestational diabetes, high blood pressure, abnormal cholesterol, or previous prediabetes.
How Often Should You Check A1C?
How often you need an A1C test depends on your result and health status.
| Situation | Common Testing Schedule |
|---|---|
| Normal result | Retesting depends on age and risk factors |
| Prediabetes | Often every 1 to 2 years |
| Diabetes meeting goals | At least twice a year |
| Diabetes not meeting goals or treatment changed | More often, as directed by your clinician |
The CDC says most people with diabetes have A1C checked at least twice a year, and people with prediabetes will likely repeat A1C every 1 to 2 years.
What Can Affect A1C Accuracy?
A1C is helpful, but it is not perfect. Some conditions can make A1C falsely high or falsely low.
Factors that may affect A1C include:
- Severe anemia
- Iron-deficiency anemia
- Kidney failure
- Liver disease
- Sickle cell anemia
- Thalassemia
- Some hemoglobin variants
- Recent blood loss
- Blood transfusion
- Hemodialysis
- Early or late pregnancy
- Certain medicines
The NIDDK notes that A1C may be unreliable when red blood cell lifespan or hemoglobin is affected. It also says some people may need a different type of A1C test if a hemoglobin variant interferes with results.
When A1C and Glucose Readings Do Not Match
Talk with your healthcare professional if your A1C does not match your home glucose readings or continuous glucose monitor data. For example, if your A1C looks normal but your glucose readings are often high, or your A1C is high but your daily readings look mostly in range, you may need repeat testing or another evaluation.
Tips to Support a Healthier A1C
A1C usually changes gradually because it reflects blood sugar over several months. Small, consistent habits can support better blood sugar management over time.
1. Know Your Personal A1C Goal
Do not assume your goal should match someone else’s. Ask your healthcare professional:
- What A1C goal is safe for me?
- How often should I test A1C?
- Should I also monitor fasting or after-meal glucose?
- What symptoms of low blood sugar should I watch for?
- Do any of my health conditions affect A1C accuracy?
This is especially important for older adults, people who use insulin or sulfonylureas, pregnant people, and anyone with kidney disease, anemia, or frequent hypoglycemia.
2. Use the Plate Method for Meals
A simple way to build more balanced meals is the plate method. The American Diabetes Association recommends starting with a 9-inch plate and filling half with non-starchy vegetables, one-quarter with lean protein, and one-quarter with quality carbohydrates such as whole grains, fruit, starchy vegetables, or low-fat dairy.
This method can help make meals easier to plan without counting every gram of carbohydrate.
3. Choose Higher-Fiber Carbohydrates
Carbohydrates affect blood sugar, but that does not mean you need to avoid all carbs. Many people do better with slower-digesting, fiber-rich choices.
Examples include:
- Beans and lentils
- Oats
- Barley
- Quinoa
- Whole fruit
- Non-starchy vegetables
- Plain yogurt or kefir
- Sweet potatoes in moderate portions
- Whole-grain breads with higher fiber
Pairing carbs with protein, fiber, and healthy fats may help reduce sharp blood sugar rises after meals.
4. Move Your Body Most Days
Regular physical activity can support blood sugar management. The CDC says physical activity is a foundation of diabetes management and helps manage blood sugar levels while lowering the risk of heart disease and other complications. It also recommends working toward at least 150 minutes of moderate-intensity activity per week, if appropriate for you.
Start small if you are inactive. A 10-minute walk after a meal can be a realistic first step. Ask your healthcare professional which activities are safe if you have heart disease, neuropathy, eye disease, balance problems, or other medical concerns.
5. Take Medication as Prescribed
If you have diabetes, lifestyle habits and medication often work together. Do not stop, skip, or change diabetes medication because of one A1C result unless your healthcare professional tells you to.
This is especially important if you use insulin or medicines that can cause low blood sugar.
6. Watch for Low Blood Sugar Risk
A lower A1C is not always better if it comes with frequent hypoglycemia. Low blood sugar can be dangerous, especially for older adults or people with heart disease, kidney disease, or fall risk.
Symptoms may include:
- Shaking
- Sweating
- Confusion
- Dizziness
- Fast heartbeat
- Weakness
- Irritability
- Blurred vision
If you have frequent lows, tell your healthcare professional. Your A1C target or medication plan may need to change.
7. Track Patterns, Not Just One Number
A1C is one tool. Your healthcare professional may also look at:
- Fasting glucose
- After-meal glucose
- Continuous glucose monitor data
- Time in range
- Kidney function
- Cholesterol
- Blood pressure
- Weight changes
- Medication side effects
- Symptoms of high or low blood sugar
This broader picture is more useful than judging your health by A1C alone.
When to Talk With a Healthcare Professional
Contact your healthcare professional if:
- Your A1C is 5.7% or higher and you have not discussed it before.
- Your A1C is 6.5% or higher.
- Your A1C is rising despite healthy changes.
- Your A1C does not match your home glucose readings.
- You have symptoms of high blood sugar, such as frequent urination, unusual thirst, blurry vision, fatigue, or unexplained weight loss.
- You have symptoms of low blood sugar.
- You are pregnant or planning pregnancy.
- You have anemia, kidney disease, liver disease, sickle cell trait, thalassemia, or recent blood loss.
Common Mistakes When Using an A1C Chart by Age
Mistake 1: Thinking “Normal for Age” Means Higher Is Fine
A1C below 5.7% is still the normal range for most adults. Older age may change the treatment goal for diabetes, but it does not turn prediabetes-range A1C into normal A1C.
Mistake 2: Comparing Your Goal to Someone Else’s
Two people can have the same A1C but different health needs. A younger adult with newly diagnosed diabetes may have a different target than an older adult with heart disease and frequent lows.
Mistake 3: Ignoring Low Blood Sugar
A lower A1C can look good on paper, but frequent hypoglycemia is not safe. This is one reason A1C goals are individualized.
Mistake 4: Using A1C Alone During Pregnancy
Pregnancy needs special glucose monitoring and medical guidance. A general A1C chart is not enough.
Mistake 5: Forgetting That A1C Can Be Inaccurate
If you have anemia, kidney failure, liver disease, hemoglobin variants, recent transfusion, or pregnancy-related changes, your A1C may not tell the full story.
FAQ About A1C Chart by Age
What is a normal A1C by age?
For most adults, a normal A1C is below 5.7% at any age. The diagnostic ranges do not usually change by age, but treatment targets for people with diabetes may change based on health status and safety.
Is A1C 6.5 normal for seniors?
No. An A1C of 6.5% is in the diabetes range for adults, including seniors. However, if an older adult already has diabetes, their personal treatment target may be different depending on overall health and hypoglycemia risk.
What should A1C be for a 70-year-old?
A healthy 70-year-old without diabetes would generally aim for the normal range below 5.7%. A 70-year-old with diabetes may have a personal target such as below 7.0% to 7.5% if healthy, or closer to below 8.0% if they have complex health issues. The goal should be set by a healthcare professional.
Is 5.7 A1C good or bad?
An A1C of 5.7% is the starting point of the prediabetes range. It does not mean diabetes, but it is a signal to talk with a healthcare professional about risk factors, lifestyle steps, and retesting.
How long does it take to lower A1C?
A1C reflects average blood sugar over about 2 to 3 months, so changes usually take time. Some improvement may appear within a few months if blood sugar patterns improve, but the timeline varies by person, medication, diet, activity, sleep, stress, and health conditions.
Can A1C be wrong?
Yes. A1C can be inaccurate in some situations, including severe anemia, kidney failure, liver disease, blood loss, transfusion, pregnancy, sickle cell anemia, thalassemia, and some hemoglobin variants. If your A1C does not match your glucose readings, ask your healthcare professional about repeat testing or alternative tests.
How often should A1C be checked?
People with diabetes often have A1C checked at least twice a year, and more often if treatment changes or goals are not being met. People with prediabetes may repeat A1C every 1 to 2 years, depending on medical advice.
Conclusion
An A1C chart by age is helpful, but it should not be used as a one-size-fits-all rule. A normal A1C is below 5.7% for most adults, while diabetes treatment targets depend on age, pregnancy status, overall health, and low blood sugar risk.
Use your A1C result as a starting point for a better conversation with your healthcare professional. Ask what your number means, what goal is safest for you, and what steps may help support healthier blood sugar over time.
This content is for informational purposes only and not medical advice.
References
- CDC — A1C Test for Diabetes and Prediabetes
- NIDDK — The A1C Test & Diabetes
- American Diabetes Association — Standards of Care in Diabetes 2026: Glycemic Goals
- American Diabetes Association — Standards of Care in Diabetes 2026: Older Adults
- CDC — National Diabetes Statistics Report
- CDC — Get Active With Diabetes
- American Diabetes Association — Eating Well & Managing Diabetes