
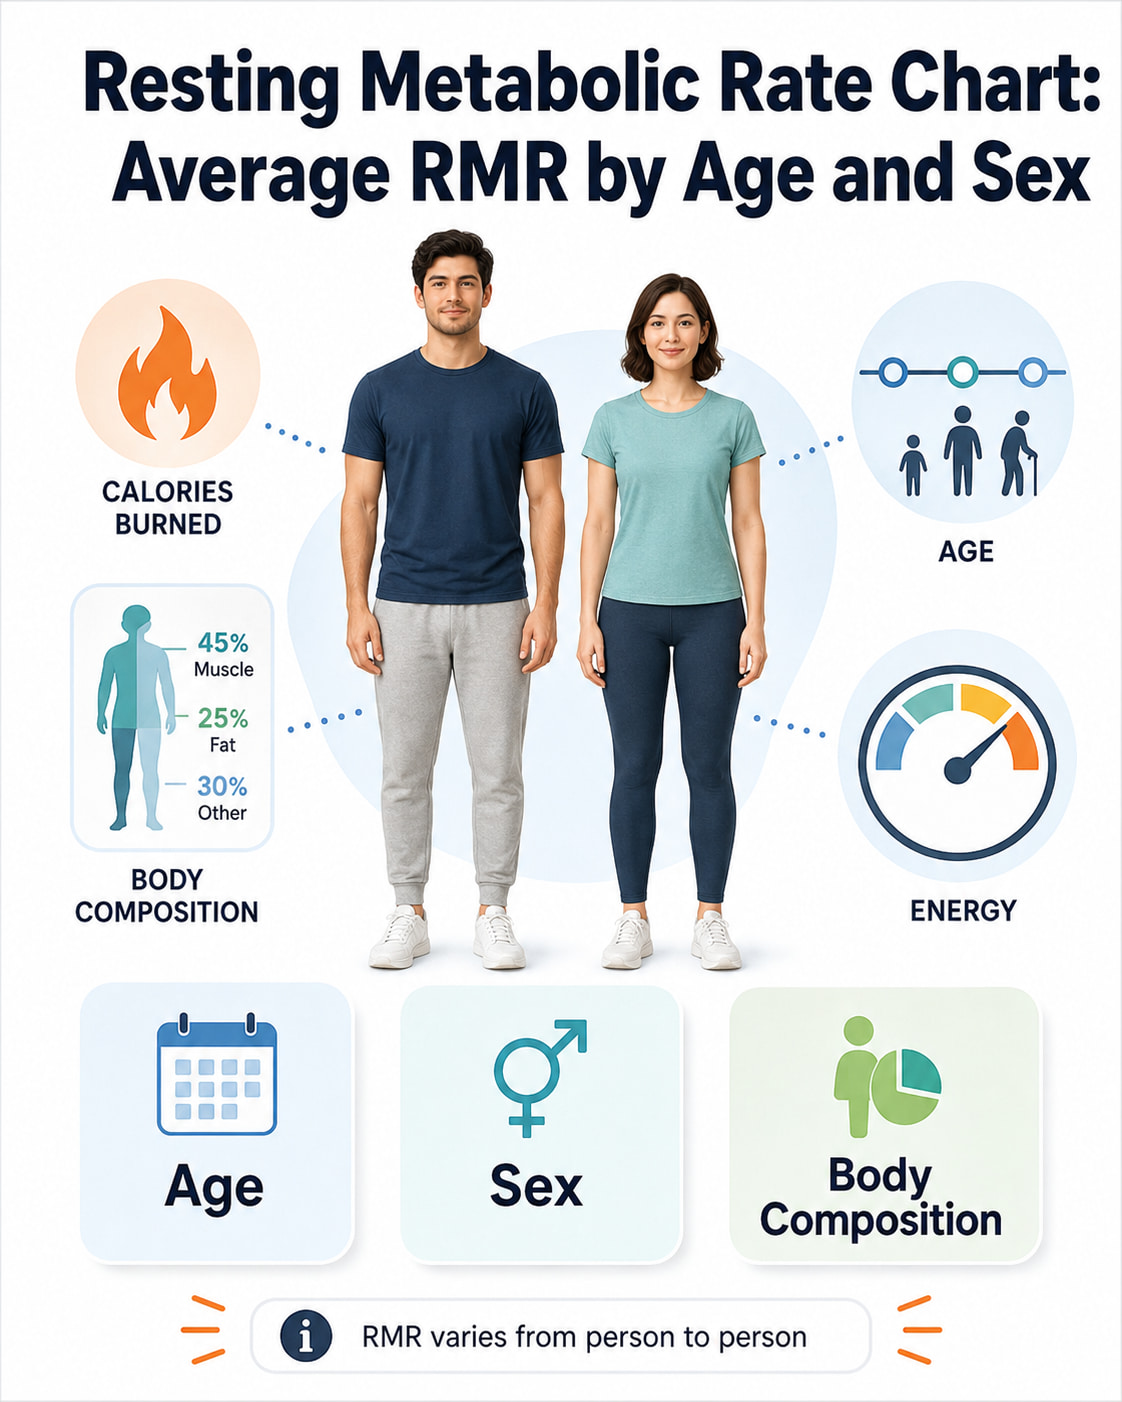
Resting metabolic rate generally decreases with age, and men tend to have a higher average RMR than women, but there is no single “normal” RMR for any age or sex. Your actual resting metabolic rate depends heavily on body size, lean mass, age, and other individual factors.
A resting metabolic rate chart can show useful population trends, but it should not be used as a diagnosis or as a fixed calorie target. Research measurements also show considerable variation among people who are the same age and sex.
Resting Metabolic Rate Chart by Age and Sex
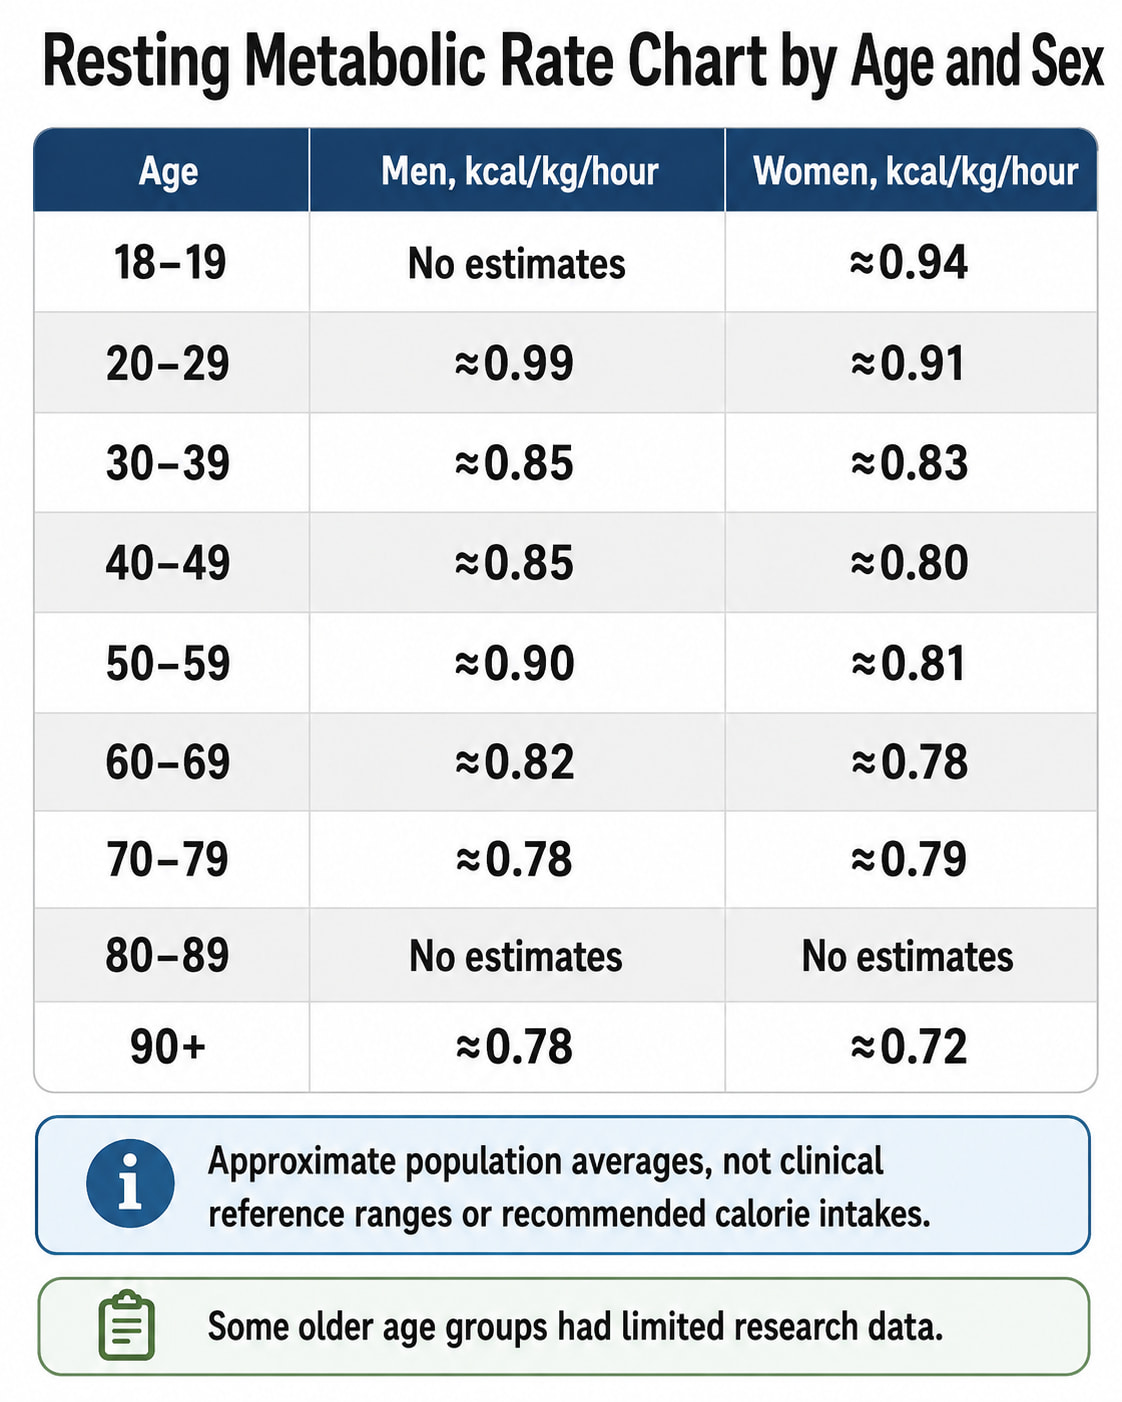
One of the largest reviews of measured adult RMR included 197 studies and 11,951 adults. Researchers analyzed 351 sex-specific population estimates and found that RMR, when expressed relative to body weight, generally decreased with age in both men and women. The full analysis is available through the Centers for Disease Control and Prevention (CDC).
The chart below summarizes the adjusted means shown in the study’s age-and-sex figure.
| Age | Men, kcal/kg/hour | Women, kcal/kg/hour |
|---|---|---|
| 18–19 | No estimates | ≈0.94 |
| 20–29 | ≈0.99 | ≈0.91 |
| 30–39 | ≈0.85 | ≈0.83 |
| 40–49 | ≈0.85 | ≈0.80 |
| 50–59 | ≈0.90 | ≈0.81 |
| 60–69 | ≈0.82 | ≈0.78 |
| 70–79 | ≈0.78 | ≈0.79 |
| 80–89 | No estimates | No estimates |
| 90+ | ≈0.78 | ≈0.72 |
Important: These are approximate population averages visually rounded from the published figure, not clinical reference ranges or recommended calorie intakes. Some age groups had very little data—for example, the 50–59 male category was based on only two publication estimates, and the 90+ categories were also sparse. This helps explain why the decade-by-decade pattern is not perfectly smooth.
The same review reported an overall measured RMR of:
- Men: 0.892 kcal/kg/hour
- Women: 0.839 kcal/kg/hour
- All adults combined: 0.863 kcal/kg/hour
The researchers specifically concluded that one RMR value is not appropriate for all adults.
What Do the RMR Numbers in the Chart Mean?
The chart uses kilocalories per kilogram of body weight per hour, rather than total calories per day.
To convert a value into a rough daily number:
RMR per day ≈ RMR in kcal/kg/hour × body weight in kg × 24
For example, if a research group has an average RMR of 0.83 kcal/kg/hour, applying that rate to a 70-kg (about 154-lb) person would give:
0.83 × 70 × 24 ≈ 1,394 calories per day
That calculation is useful for understanding the units, but it does not mean every 70-kg person in that age group has an RMR of 1,394 calories. Individual RMR can differ considerably.
What Is a Normal Resting Metabolic Rate?
There is no universally accepted normal daily RMR range such as “1,400–1,600 calories for women” or “1,700–2,000 calories for men.”
Those types of ranges may describe some people, but they ignore major differences in height, weight, lean mass, and age.
The large adult RMR review found substantial differences according to sex, age, and body-size categories. Researchers therefore cautioned against applying one standard RMR value to every adult.
A better question is:
Is my measured or estimated RMR reasonable for my body size, age, and body composition?
That requires more information than age and sex alone.
Does Resting Metabolic Rate Decrease With Age?
RMR tends to decline with aging, although the amount differs from person to person.
A study published in Experimental Gerontology in May 2026 examined 80 healthy adults ages 23 to 82. Researchers measured body composition with DXA and RMR with indirect calorimetry. The study is indexed by the National Library of Medicine.
Even after accounting for body composition and sex, increasing age remained associated with lower RMR. The statistical model predicted a decline of approximately 62.6 calories per day per decade.
That number should not be interpreted as a rule that everyone’s metabolism drops exactly 63 calories every 10 years. It describes the association found in this particular healthy-aging cohort.
Why can RMR decline with age?
Body composition is one major reason. Lean tissue is metabolically active and contributes substantially to resting energy use. Changes in lean mass with aging can therefore affect RMR.
However, the 2026 study found that aging remained associated with lower RMR even after researchers adjusted for measured body-composition differences. This suggests that body composition alone does not explain the entire age-related change.
Why Is Average RMR Higher in Men Than Women?
Population studies commonly find a higher unadjusted RMR in men.
In the large adult review, average measured RMR was 0.892 kcal/kg/hour in men versus 0.839 kcal/kg/hour in women.
This does not mean biological sex alone determines metabolism.
The 2026 healthy-aging study found that when researchers simultaneously accounted for several body-composition measures—including lean tissue mass, body fat, and body surface area—the observed difference between men and women could be explained by those body-composition differences.
In practical terms, two people of different sexes who have similar amounts of metabolically active tissue may have RMR values that are closer than a simple male-versus-female chart suggests.
Body Size Can Change How You Interpret an RMR Chart
RMR expressed as calories per kilogram can be misleading if you assume it works the same way as total daily RMR.
The adult RMR review found these average weight-adjusted measurements:
| BMI Group | Men | Women |
|---|---|---|
| BMI under 25 | 0.960 kcal/kg/hour | 0.926 kcal/kg/hour |
| BMI 30 or higher | 0.791 kcal/kg/hour | 0.721 kcal/kg/hour |
A lower number per kilogram does not necessarily mean a person with a larger body burns fewer total calories at rest. Absolute RMR may still be higher because there is more total tissue to support. The distinction occurs partly because fat tissue and lean tissue contribute differently to resting energy expenditure.
How to Estimate Your Resting Metabolic Rate
For an individual estimate, a prediction equation that includes height and weight is usually more useful than choosing a number from an age chart.
The National Center for Biotechnology Information (NCBI) provides the Mifflin–St Jeor equations in Endotext for adults older than 19.
Mifflin–St Jeor Equation for Men
RMR = (9.99 × weight in kg) + (6.25 × height in cm) − (4.92 × age) + 5
Mifflin–St Jeor Equation for Women
RMR = (9.99 × weight in kg) + (6.25 × height in cm) − (4.92 × age) − 161
The result is an estimated number of calories used per day at rest.
Example RMR Calculation
Consider a 35-year-old man who:
- Weighs 180 lb, or about 81.6 kg
- Is 5 feet 10 inches tall, or about 177.8 cm
Using Mifflin–St Jeor:
RMR ≈ 1,760 calories per day
That does not mean he should eat exactly 1,760 calories. It is simply an estimate of resting energy expenditure.
Prediction equations are useful, but they cannot perfectly reproduce an individual’s measured metabolism. Research comparing commonly used equations has found that even relatively reliable equations such as Mifflin–St Jeor do not predict measured RMR accurately for every person.
RMR vs. BMR: Are They the Same?
Resting metabolic rate and basal metabolic rate are closely related but technically different.
- RMR measures the energy your body uses while resting under controlled conditions.
- BMR, or basal metabolic rate, traditionally requires stricter conditions, such as an overnight fast and substantial pre-test rest.
Because RMR testing is somewhat less restrictive, RMR and BMR values should not automatically be treated as identical even though the terms are sometimes used interchangeably in everyday health and fitness discussions.
What Factors Affect Resting Metabolic Rate?
Age and sex are only part of the picture. Important influences include:
- Body size: Larger bodies generally require more total energy at rest.
- Lean body mass: Muscle, organs, and other lean tissues contribute substantially to resting energy expenditure.
- Body composition: Two people with the same weight can have different RMRs because their proportions of lean and fat tissue differ.
- Age: Average RMR tends to decrease with advancing age.
- Sex-related body-composition differences: These help explain population differences between men and women.
- Testing conditions: Food, exercise, nicotine, alcohol, and inadequate rest before a metabolic test can affect the result.
Research comparing RMR measurements emphasizes standardized preparation because seemingly small differences in testing conditions can influence the result.
How Is Resting Metabolic Rate Measured?
If greater precision is needed, RMR can be measured with indirect calorimetry.
The National Institute of Diabetes and Digestive and Kidney Diseases (NIDDK) explains that metabolic carts measure the oxygen a person inhales and the carbon dioxide they exhale. Those measurements allow researchers or clinicians to calculate energy expenditure during rest.
For reliable RMR testing, preparation may include fasting, avoiding recent strenuous activity, and resting quietly before the measurement. A systematic review of measurement practices recommended at least seven hours of fasting and about 30 minutes of quiet rest under controlled conditions for non-critically ill individuals.
If you are having RMR measured professionally, follow the specific preparation instructions provided by the testing facility.
RMR Is Not Your Daily Calorie Requirement
One of the most important things to understand about a resting metabolic rate chart is that RMR is not the same as total daily energy expenditure.
Your body also uses calories for:
- Walking and other everyday movement
- Exercise
- Digesting and processing food
- Household and occupational activities
- Other movement throughout the day
NIDDK explains that energy use rises above resting levels as daily activities and exercise are added.
For this reason, you should not automatically treat your RMR as either your maintenance calorie target or the number of calories you should eat for weight loss.
For adults interested in personalized calorie and activity planning, the NIDDK Body Weight Planner uses a broader model of energy balance rather than relying on RMR alone. It is not intended for people younger than 18 or for those who are pregnant or breastfeeding.
How to Use a Resting Metabolic Rate Chart Correctly
A resting metabolic rate chart is most useful for seeing population trends, not judging whether your metabolism is “good” or “bad.”
Use it to understand that:
- RMR generally changes with age.
- Men and women have different population averages.
- Body size and lean mass can substantially change an individual’s result.
- An RMR equation provides an estimate, not a laboratory measurement.
- Your RMR is only one component of total daily calorie needs.
If a calculated RMR appears surprisingly high or low, first check that your age, weight, height, units, and equation were entered correctly. A measured indirect-calorimetry test can provide more individualized information when greater accuracy is important.
Frequently Asked Questions
What is a good RMR for my age?
There is no single “good” or normal RMR for an age group. RMR varies with weight, height, lean mass, body composition, age, and individual physiology. A prediction equation or direct measurement is more informative than comparing yourself with one age-based number.
Is an RMR of 1,500 calories normal?
It can be reasonable for some adults, but the number cannot be interpreted without additional information. An RMR of 1,500 calories may be relatively high for one person and relatively low for another depending on body size, age, sex, and lean mass.
At what age does RMR start to decrease?
There is no universal age at which metabolism suddenly slows. Population research shows a general decline with advancing adulthood rather than one sharp cutoff. The 2026 healthy-aging study found an age-related association across adults ages 23–82.
Is RMR lower in women?
Average unadjusted measured RMR is generally lower in women than men in population studies. However, differences in body size and body composition explain much of that gap, so sex alone cannot accurately predict an individual’s RMR.
Is RMR the minimum number of calories I should eat?
No. RMR measures estimated or measured energy use while resting; it is not a universal minimum calorie-intake rule. Appropriate intake depends on total energy expenditure, nutritional needs, health, activity, and individual goals. NIDDK uses personalized calorie and activity modeling when estimating weight-management needs rather than RMR alone.
Is a calculated RMR accurate?
It is an estimate. Equations such as Mifflin–St Jeor are useful for many adults, but prediction errors occur because formulas cannot account for every difference in body composition and physiology. Indirect calorimetry provides an individualized measurement when greater precision is required.
Can exercise increase resting metabolic rate?
Changes in body composition, particularly metabolically active lean tissue, can influence RMR. However, the size of any change varies, and exercise should not be viewed as a guaranteed way to increase resting calorie expenditure by a specific amount. Regular physical activity also increases overall energy expenditure independently of RMR.
Conclusion
A resting metabolic rate chart is useful for understanding broad metabolic patterns, but it cannot tell you exactly how many calories your body burns at rest.
Research shows that RMR generally declines with age and is higher on average in men than women, while body size and body composition account for substantial person-to-person differences. Recent 2026 research also suggests that age-related changes cannot be explained by body composition alone.
For a personal estimate, use an established equation such as Mifflin–St Jeor with your own height, weight, and age. If accurate measurement matters for clinical or specialized nutrition planning, discuss indirect calorimetry and your overall energy needs with a qualified healthcare professional or registered dietitian.
This content is for informational purposes only and not medical advice.
References
- Moliné M, et al. Effects of Body Composition on Age- and Sex-Related Differences in Resting Metabolic Rate From a Healthy Aging Cohort — PubMed, 2026
- McMurray RG, et al. Examining Variations of Resting Metabolic Rate of Adults: A Public Health Perspective — CDC Stacks
- Resting Metabolic Rate Data and Figures — CDC Stacks PDF
- Estimating Resting Metabolic Rate With the Mifflin–St Jeor Equation — NCBI Endotext
- Metabolic Testing — National Institute of Diabetes and Digestive and Kidney Diseases (NIDDK)
- Body Weight Planner — National Institute of Diabetes and Digestive and Kidney Diseases (NIDDK)
- Comparison of Predictive Equations for Resting Metabolic Rate in Healthy Nonobese and Obese Adults — PubMed
- Best Practice Methods to Apply to Measurement of Resting Metabolic Rate in Adults — PubMed