
A commonly cited healthy body fat percentage for men is 8%–19% at ages 20–39, 11%–21% at ages 40–59, and 13%–24% at ages 60–79. However, these figures are reference ranges—not universal medical cutoffs or personalized fitness targets.
Your age, muscle mass, fat distribution, health history, fitness level, and measurement method all affect how a body fat result should be interpreted. Use this body fat percentage chart for men as a guide, then consider the number alongside waist circumference, strength, blood pressure, laboratory results, and advice from a qualified healthcare professional.
Quick Body Fat Percentage Chart for Men
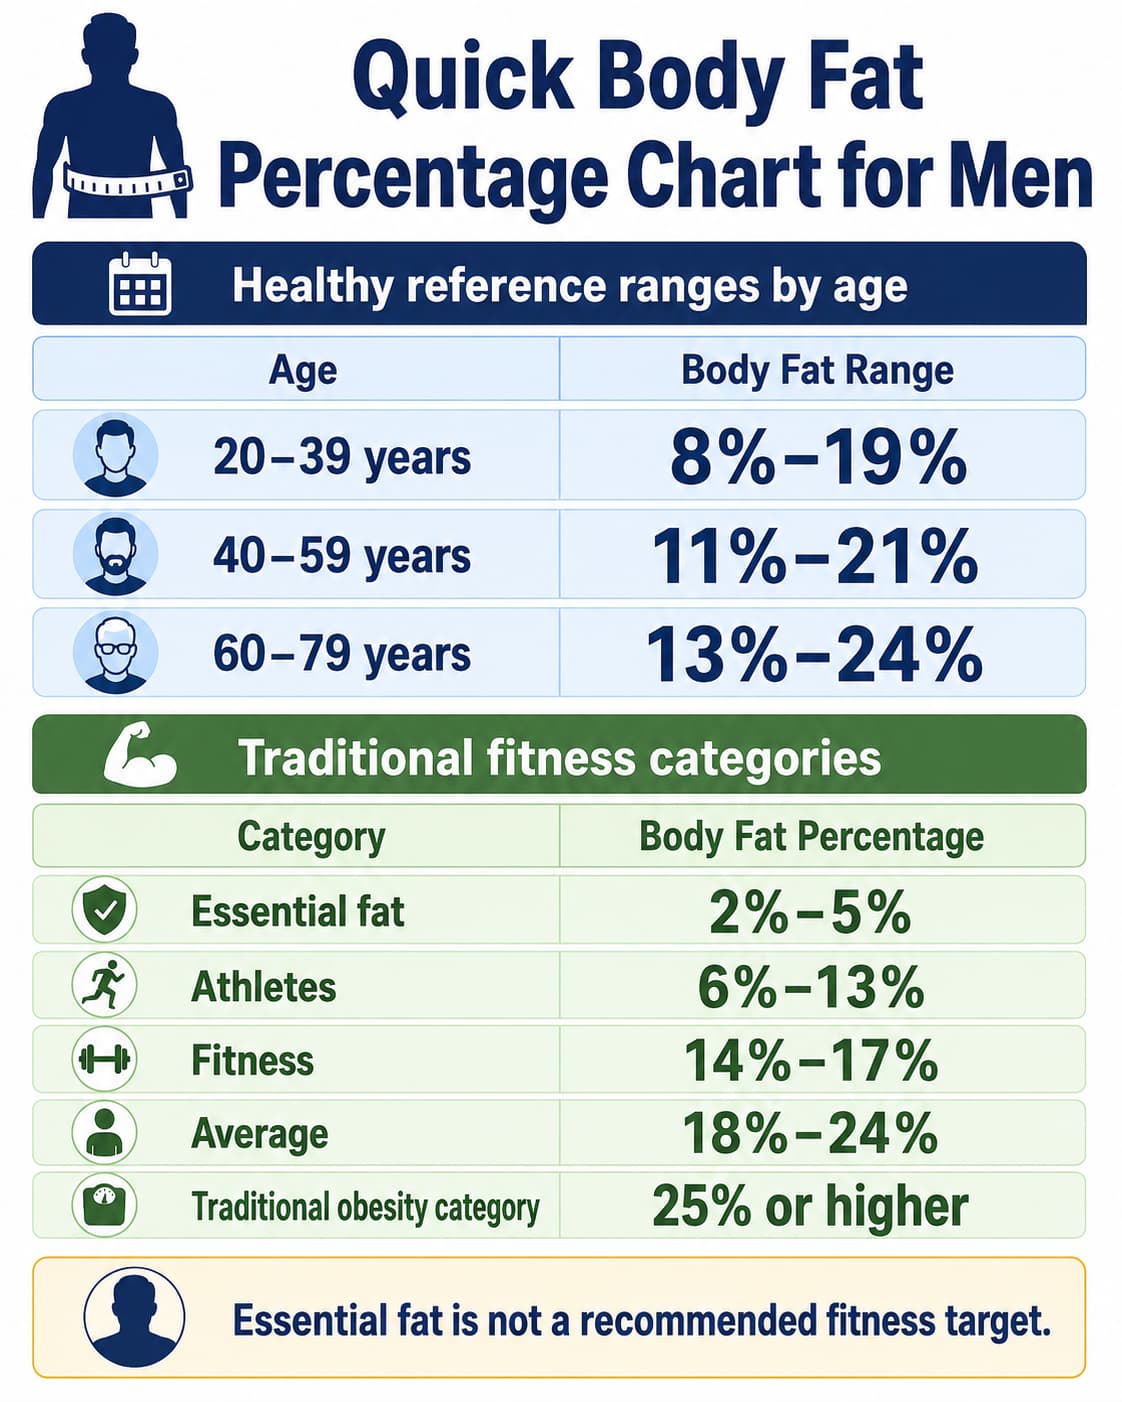
The following age ranges come from research that linked estimated body fat percentages with established healthy BMI categories.
| Age | Commonly Cited Healthy Body Fat Range |
|---|---|
| 20–39 years | 8%–19% |
| 40–59 years | 11%–21% |
| 60–79 years | 13%–24% |
The underlying study, available through the National Library of Medicine, described these numbers as a proposed approach for developing body fat guidelines. They should not be treated as exact diagnostic thresholds for every man.
A second chart is commonly used in fitness settings:
| Traditional Fitness Category | Body Fat Percentage for Men |
|---|---|
| Essential fat | 2%–5% |
| Athletes | 6%–13% |
| Fitness | 14%–17% |
| Average | 18%–24% |
| Obesity category in the traditional chart | 25% or higher |
These are traditional American Council on Exercise classifications. They describe broad fitness categories rather than individualized medical diagnoses. The organization also emphasizes that measurement methods have different advantages and limitations.
Important: The 2%–5% essential-fat category is not a recommended goal. The American Council on Exercise notes that body fat below approximately 6% in men may be dangerously low.
What Is Body Fat Percentage?
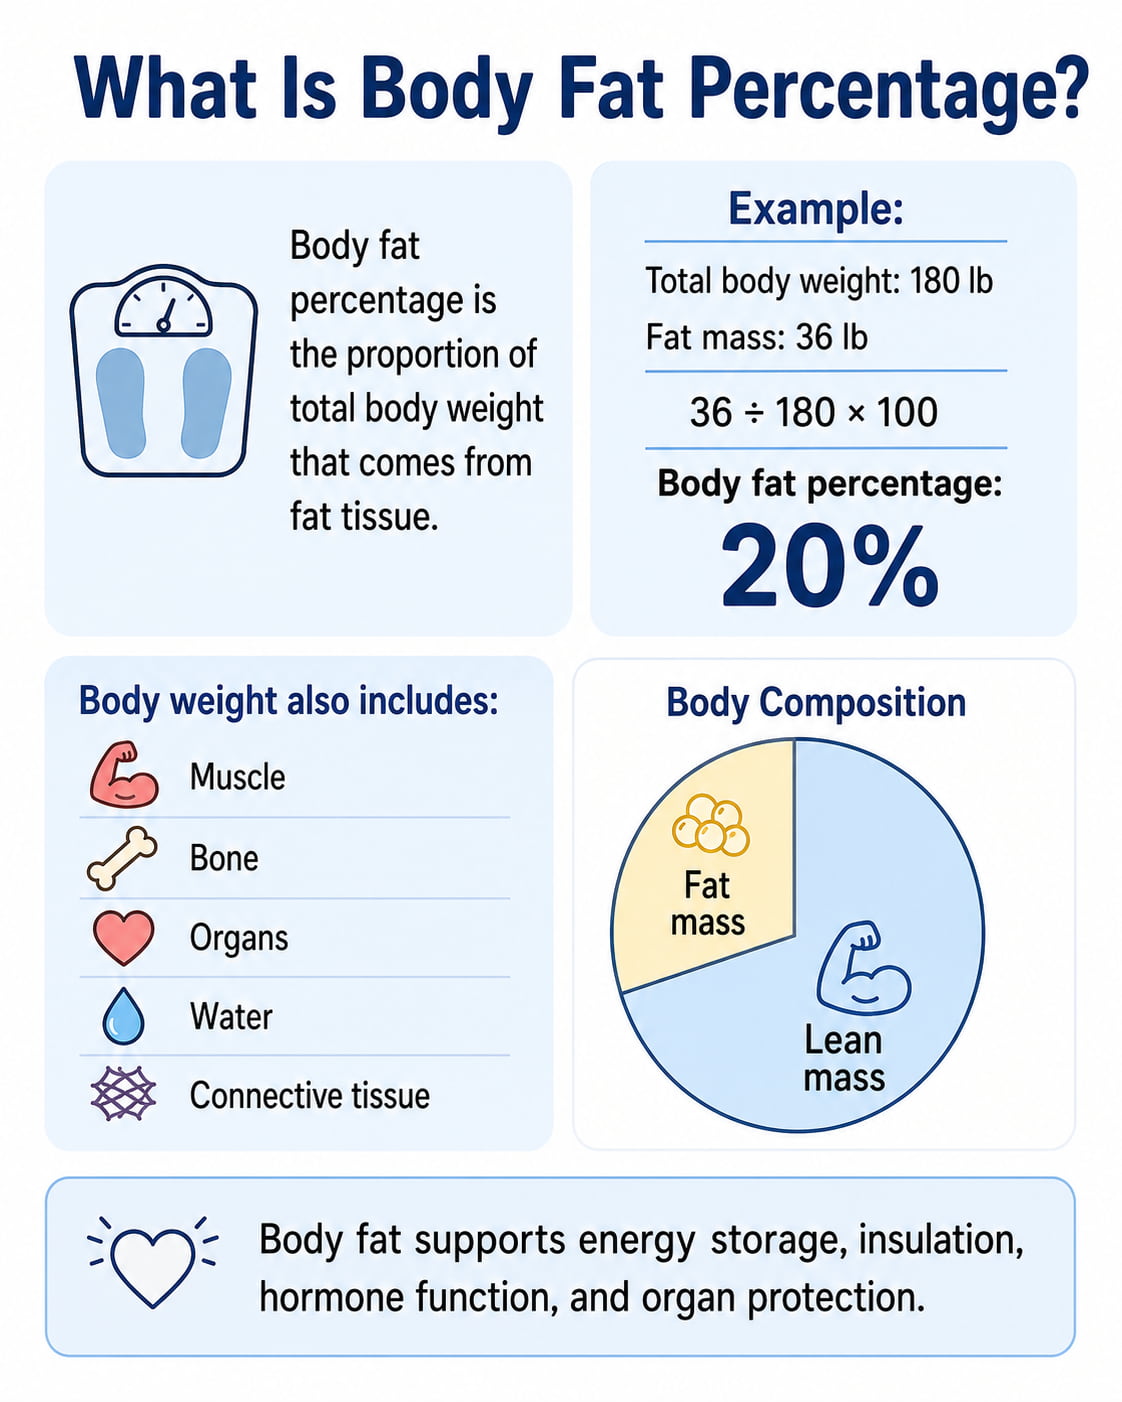
Body fat percentage is the proportion of your total body weight that comes from fat tissue.
For example, a 180-pound man with 36 pounds of fat mass has 20% body fat:
36 ÷ 180 × 100 = 20%
The rest of his weight includes muscle, bone, organs, water, connective tissue, and other fat-free tissues.
Body fat performs essential functions. It stores energy, helps insulate the body, cushions organs, and participates in hormone and metabolic processes. Therefore, the goal should not automatically be to achieve the lowest possible percentage.
Body Fat Percentage Chart for Men by Age
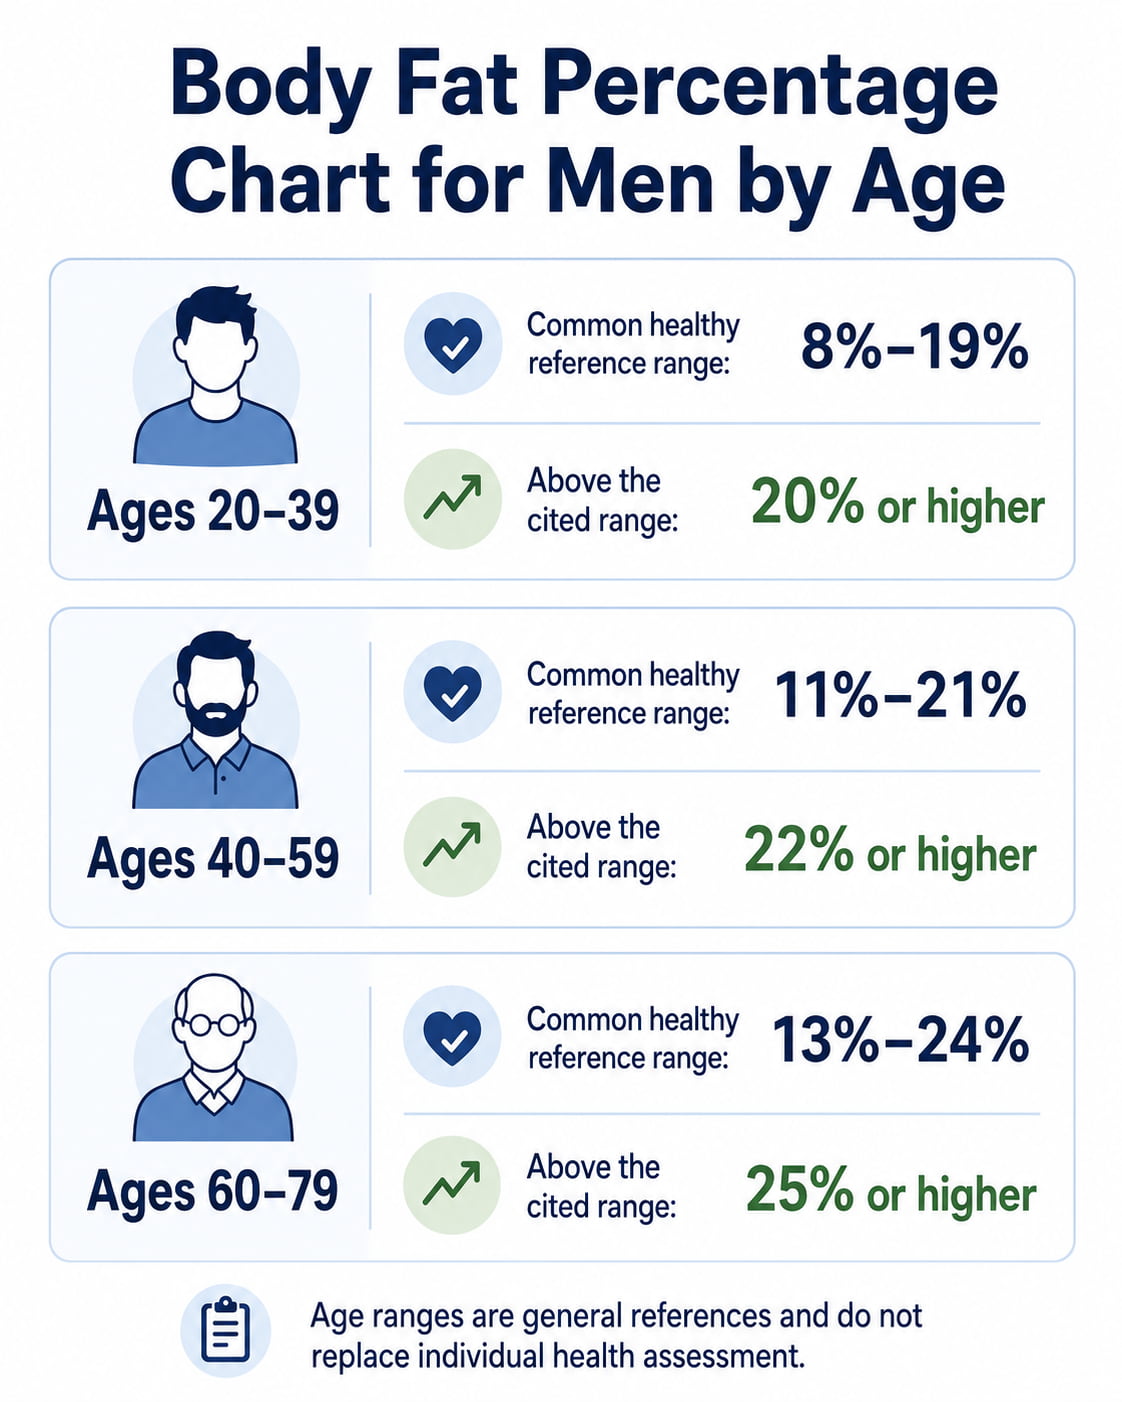
Body Fat Percentage for Men Ages 20–39
| Classification | Body Fat Percentage |
|---|---|
| Common healthy reference range | 8%–19% |
| Above the cited age-based range | 20% or higher |
Men in their 20s and 30s commonly have more lean mass than older men, especially when they regularly perform resistance exercise. However, fitness, genetics, nutrition, sleep, medical conditions, and activity level can create major differences between people of the same age.
A result below 8% is not automatically unhealthy. Some trained athletes may naturally or temporarily fall below this level. However, very low percentages require caution, especially when accompanied by fatigue, reduced performance, poor recovery, mood changes, low libido, dizziness, or restrictive eating.
Body Fat Percentage for Men Ages 40–59
| Classification | Body Fat Percentage |
|---|---|
| Common healthy reference range | 11%–21% |
| Above the cited age-based range | 22% or higher |
The commonly cited range increases slightly in middle age. Changes in activity, muscle mass, hormones, sleep, work routines, and energy intake may all influence body composition.
A man can remain the same weight while losing muscle and gaining fat. For this reason, body weight alone may not show an important change in body composition.
Body Fat Percentage for Men Ages 60–79
| Classification | Body Fat Percentage |
|---|---|
| Common healthy reference range | 13%–24% |
| Above the cited age-based range | 25% or higher |
For older men, maintaining muscle, strength, mobility, and balance may be as important as reducing excess fat.
Historical data from the CDC’s National Center for Health Statistics showed that male fat-free mass generally declined across older age groups, while average body fat percentage was highest among men ages 60–79 and those 80 and older.
What About Men Ages 80 and Older?
The commonly used Gallagher chart stops at age 79. It does not establish a specific healthy range for men aged 80 or older.
Do not automatically extend the 60–79 range to every older adult. Health professionals may place greater emphasis on:
- Muscle strength and physical function
- Fall risk and balance
- Unintentional weight loss
- Waist circumference
- Medical conditions
- Ability to perform everyday activities
- Adequate nutrition
Body Fat Percentage for Men by Fitness Level
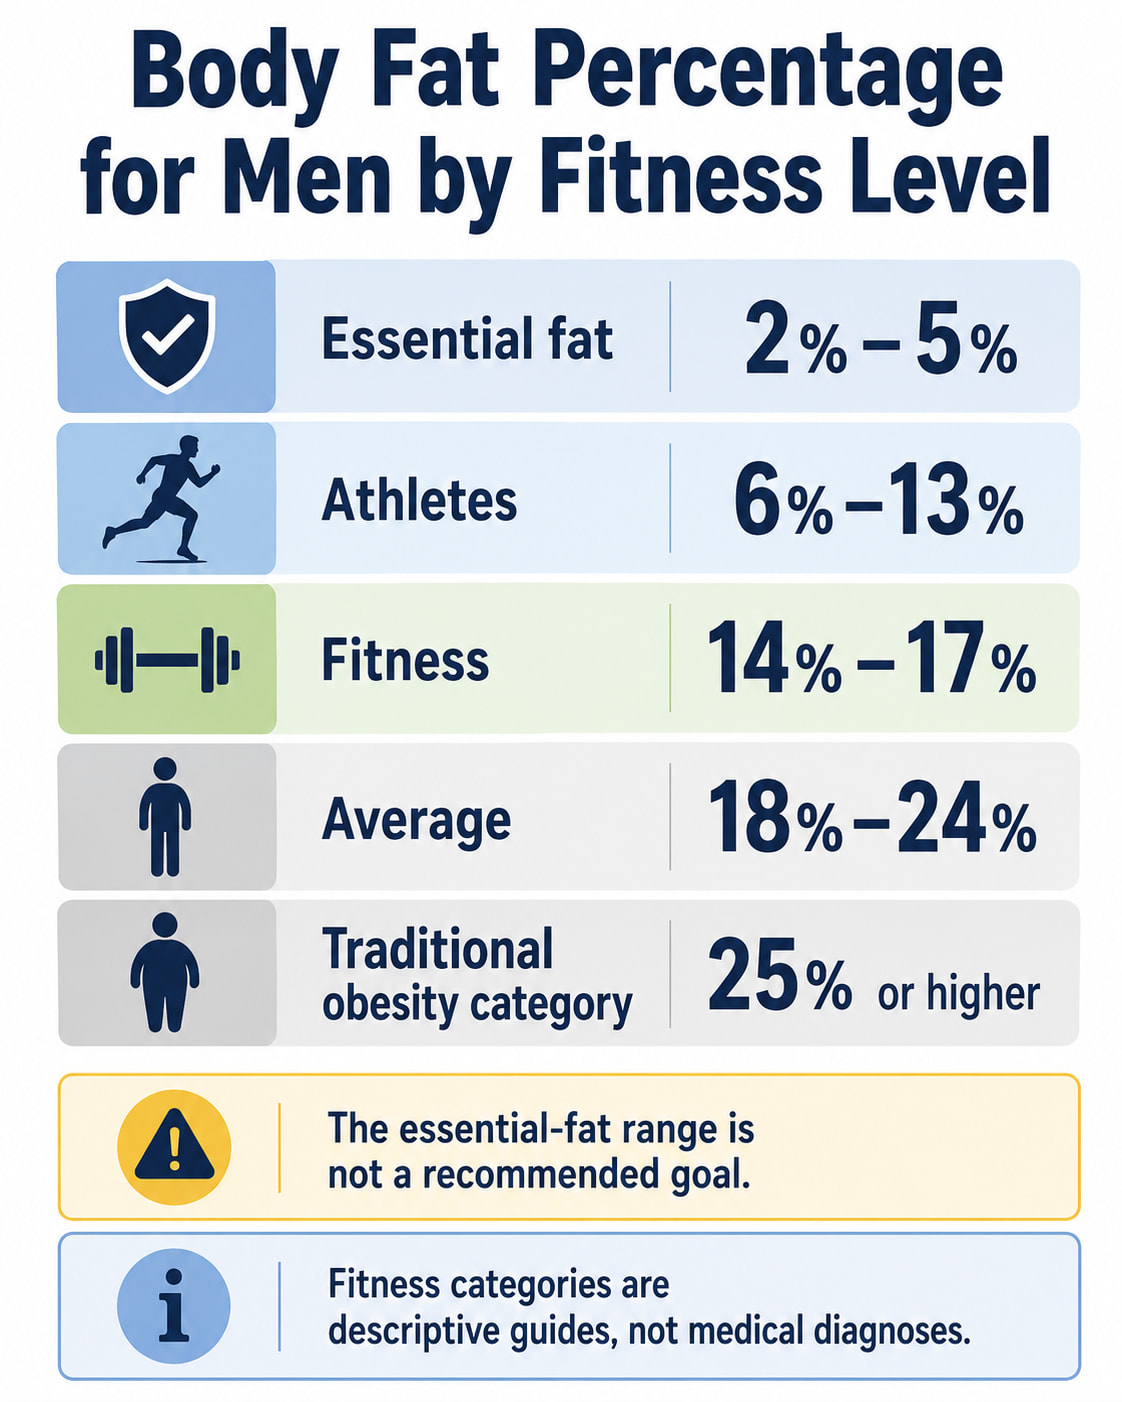
Age-based ranges and fitness classifications answer different questions. The age chart provides general health context, while the fitness chart groups people by typical body-composition characteristics.
Essential Fat: 2%–5%
Essential fat is the minimum amount required for basic physiological functions. This range is not intended as a general weight-loss or fitness goal.
Maintaining body fat at the very bottom of this range may be difficult and potentially harmful. A reading this low should also be questioned if it came from a home scale, because consumer devices can have meaningful estimation errors.
Athlete Range: 6%–13%
Some competitive male athletes fall within this range, particularly in sports where a high strength-to-weight ratio or low body mass may affect performance.
Being in the athlete range does not automatically mean a person is healthier. A sustainable level depends on the sport, training cycle, age, genetics, recovery, diet, and overall health.
Fitness Range: 14%–17%
This classification is commonly associated with a lean, physically active body composition. Many men can maintain this range without using the highly restrictive practices sometimes needed for single-digit body fat.
However, a percentage in this category does not confirm cardiovascular fitness, strength, healthy blood pressure, or normal laboratory results.
Average Range: 18%–24%
The American Council on Exercise describes 18%–24% as typical for an average male nonathlete. “Average” is a descriptive fitness label, not a guarantee of good or poor health.
A man at 20% body fat could have strong fitness markers and healthy laboratory results, while another man with the same percentage could have low muscle mass, a larger waist, and metabolic risk factors.
Body Fat of 25% or Higher
The traditional American Council on Exercise chart labels 25% and higher as obesity. Newer outcome-based research has proposed a different interpretation.
A study published in the April 2025 issue of The Journal of Clinical Endocrinology & Metabolism analyzed data from 16,918 U.S. adults. According to the Endocrine Society, the researchers proposed 25% body fat as an overweight-equivalent threshold for men and 30% as an obesity-equivalent threshold based on the prevalence of metabolic syndrome.
These newer numbers have not replaced all existing fitness charts or become a universal clinical standard. They demonstrate why a single percentage should not be interpreted without context.
Healthy Body Fat Percentage vs. Average Body Fat Percentage
A population average tells you what researchers observed. It does not necessarily represent an ideal or recommended level.
The following figures come from CDC/NCHS DXA measurements collected during the 1999–2004 National Health and Nutrition Examination Survey.
| Age Group | Historical Average for U.S. Males |
|---|---|
| 16–19 years | 22.9% |
| 20–39 years | 26.1% |
| 40–59 years | 28.6% |
| 60–79 years | 30.8% |
| 80 years and older | 30.7% |
| Men 20 and older, age-adjusted | 28.1% |
These are historical U.S. population averages, not current targets. The report included valid body-composition measurements from thousands of participants and used DXA scans to estimate fat mass and lean tissue.
The difference between the healthy reference chart and the observed CDC averages is important. For example, the historical average for men ages 20–39 was 26.1%, while the commonly cited age-based reference range ends at 19%.
Therefore, being “average” does not automatically mean being within a recommended reference range.
How to Interpret 10%, 15%, 20%, 25%, and 30% Body Fat
| Body Fat Result | General Interpretation for Men |
|---|---|
| 10% | Within all three age-based reference ranges and within the traditional athlete category |
| 15% | Within all age-based ranges and within the traditional fitness category |
| 20% | Above the 20–39 reference range but within the ranges for ages 40–79; also within the average fitness category |
| 25% | Above all three age-based healthy bands; traditionally labeled obesity by ACE but proposed as an overweight-equivalent threshold in newer research |
| 30% | Above the age-based ranges and equal to the newer proposed obesity-equivalent threshold for men |
These interpretations show where a reading falls on common charts. They do not diagnose an individual.
Is 10% Body Fat Good for a Man?
Ten percent falls within the athlete classification and within each age-based reference range. It may be sustainable for some active men but difficult for others.
There is usually no need to reduce an already-low percentage simply to reach a smaller number.
Is 15% Body Fat Good for a Man?
Fifteen percent falls within the traditional fitness category and each commonly cited age range. Many people consider it a lean, realistic fitness level, although appearance and health still vary significantly.
Is 20% Body Fat Healthy for a Man?
Twenty percent falls within the age-based reference ranges for men ages 40–79 and the traditional average category. It is slightly above the commonly cited 8%–19% range for men ages 20–39.
Its health significance depends on additional factors such as waist size, physical activity, muscle mass, blood pressure, cholesterol, and glucose levels.
Is 25% Body Fat High for a Man?
Twenty-five percent is above each commonly cited age-based healthy range. It is labeled obesity in the traditional American Council on Exercise fitness chart, while newer outcome-based research describes it as an overweight-equivalent threshold.
A healthcare professional should not diagnose obesity or estimate disease risk from this number alone.
Is 30% Body Fat High for a Man?
Thirty percent is above the commonly cited age and fitness ranges. It also matches the obesity-equivalent threshold proposed in the 2025 metabolic-syndrome study.
Clinical assessment should still consider symptoms, organ function, physical limitations, waist measurements, laboratory results, and other risk factors.
Why Healthy Body Fat Percentage Changes With Age
Body composition commonly changes as men get older. Some men gain fat, lose muscle, or experience both changes without a dramatic difference on the bathroom scale.
The CDC’s historical DXA results found average male body fat levels of 26.1% at ages 20–39, 28.6% at ages 40–59, and 30.8% at ages 60–79. The same report showed lower fat-free mass in successive older age groups after middle age.
These trends do not mean that fat gain or major muscle loss is unavoidable. Regular resistance exercise, aerobic activity, adequate nutrition, recovery, and management of health conditions can support healthier body composition throughout adulthood.
Body Fat Percentage vs. BMI vs. Waist Circumference
No single measurement provides a complete picture.
| Measurement | What It Shows | Main Limitation |
|---|---|---|
| Body fat percentage | Estimated proportion of fat and fat-free mass | Accuracy depends on the device and method |
| BMI | Weight relative to height | Does not separate fat from muscle |
| Waist circumference | Central or abdominal size | Does not measure total body fat or muscle mass |
| Scale weight | Total body weight | Cannot show whether changes came from fat, muscle, or water |
BMI remains a quick and inexpensive screening tool, but it should be interpreted with other factors. The CDC states that individual BMI assessment should also consider findings such as blood pressure, cholesterol, and physical examination.
The World Health Organization calls BMI a surrogate marker of fatness and notes that measurements such as waist circumference can assist obesity assessment.
Why Waist Circumference Matters
Two men can have the same body fat percentage but store fat differently.
Subcutaneous fat sits beneath the skin. Visceral fat is stored more deeply around internal organs. A larger waist may suggest greater central fat accumulation, which is why waist circumference can add useful information that total body fat percentage misses.
The 2025 Lancet Commission framework also emphasizes that obesity assessment should move beyond a single BMI or body-fat number. It describes clinical obesity as excess adiposity accompanied by organ dysfunction or substantial physical limitation.
How Is Body Fat Percentage Measured?
Every measurement method is an estimate. Results from different methods should not be treated as interchangeable.
| Method | Advantages | Limitations |
|---|---|---|
| DXA scan | Measures fat, lean tissue, and bone; useful clinical detail | Cost, availability, and low-dose radiation exposure |
| Bioelectrical impedance analysis | Quick, noninvasive, and widely available | Hydration, food, exercise, and device equations can affect readings |
| Smart scale | Convenient for home trend tracking | Individual estimates may differ from clinical methods |
| Skinfold calipers | Affordable and portable | Accuracy depends heavily on tester skill and measurement sites |
| BOD POD | Uses air displacement and is noninvasive | Limited availability and relatively high cost |
| Hydrostatic weighing | Established laboratory method | Requires underwater testing and careful technique |
| Tape-measure formula | Accessible and inexpensive | Provides a rough estimate rather than direct measurement |
| MRI or CT | Detailed imaging of body tissues | Expensive; CT also involves radiation and is not normally used only to check body fat |
DXA Scans
Dual-energy X-ray absorptiometry, commonly called DXA or DEXA, uses low-dose X-rays to estimate fat, lean tissue, and bone.
CDC documentation describes whole-body DXA as valuable for measuring body composition because of its speed, ease of use, and strong correlation with criterion methods. It generally provides a more detailed estimate of body composition than BMI.
A DXA result may still differ between machines, software versions, facilities, and testing conditions.
Bioelectrical Impedance and Smart Scales
Bioelectrical impedance analysis sends a small electrical current through the body and uses resistance to estimate body water, fat-free mass, and fat mass.
It is convenient, but hydration can influence the result. Research has found that acute fluid intake can alter BIA-estimated body fat percentage.
A smart scale may still be useful for following trends when you:
- Use the same device
- Measure at approximately the same time
- Follow similar hydration and meal conditions
- Avoid measuring immediately after strenuous exercise
- Focus on changes over weeks or months
Skinfold Calipers
Skinfold testing measures the thickness of folds at selected body sites. The measurements are entered into an equation to estimate total body fat.
Accuracy depends on using the correct sites, applying consistent pressure, and having a trained tester. A result from one equation or tester may not match another.
Tape-Measure Formulas
Tape methods estimate body fat from measurements such as the waist and neck. They are inexpensive and easy to repeat but are less individualized than a professional body-composition assessment.
For home tracking, waist circumference by itself may be more useful and easier to reproduce than a complicated body-fat formula.
How to Get More Consistent Body Fat Readings
A single reading can be misleading. Use the following approach to improve consistency:
- Use the same device or testing method each time.
- Measure under similar conditions.
- Test at roughly the same time of day.
- Follow the device manufacturer’s preparation instructions.
- Avoid comparing a smart-scale result directly with a DXA or skinfold result.
- Record waist circumference, weight, and strength changes as well.
- Look at the long-term trend instead of daily fluctuations.
For example, a smart scale might estimate 22% while a DXA scan reports 25%. That difference does not necessarily mean one test was performed incorrectly. The devices use different technologies and prediction models.
How to Support a Healthier Body Composition
A healthier body composition generally means maintaining or increasing useful lean mass while keeping excess fat at a level appropriate for your health and circumstances.
Include Resistance Exercise
Strength training supports muscle maintenance and physical function. Useful options include:
- Squats or chair stands
- Rows
- Push-ups or chest presses
- Hip hinges
- Step-ups
- Overhead presses
- Resistance-band exercises
Progress gradually and use a load that allows controlled technique.
Add Regular Aerobic Activity
Walking, cycling, swimming, jogging, dancing, and recreational sports can support cardiovascular fitness and energy balance.
Current CDC guidance recommends at least 150 minutes of moderate-intensity aerobic activity each week, or 75 minutes of vigorous activity, plus muscle-strengthening exercise on at least two days. Adults 65 and older should also include balance activities.
Choose Sustainable Eating Habits
A balanced pattern can include:
- Vegetables and fruits
- Whole grains
- Beans and legumes
- Fish, poultry, eggs, dairy, soy, or other protein-rich foods
- Nuts and seeds
- Appropriate portions
- Mostly water or unsweetened drinks
When fat loss is appropriate, gradual and sustainable changes are usually more practical than highly restrictive diets. A registered dietitian can help create a plan that protects nutrition and lean mass.
Monitor More Than the Scale
Track indicators that reflect health and function, such as:
- Waist measurement
- Strength and exercise performance
- Energy levels
- Sleep quality
- Blood pressure
- Blood glucose and cholesterol results
- Mobility and everyday function
- How clothing fits
A successful program may reduce waist size or increase strength even when scale weight changes slowly.
When to Speak With a Healthcare Professional
Consider professional guidance when:
- Your body fat reading is unexpectedly very high or very low.
- Your weight or body composition changes rapidly without an obvious reason.
- You experience fatigue, dizziness, weakness, reduced libido, or poor exercise recovery.
- You have diabetes, heart disease, kidney disease, an eating disorder, or another condition that affects nutrition or exercise.
- You are losing strength or muscle as you age.
- Body-fat tracking is causing anxiety or restrictive eating.
- You want help interpreting conflicting results from different devices.
A clinician may evaluate your full health picture rather than focusing on one percentage.
Frequently Asked Questions
What is a healthy body fat percentage for a man?
Commonly cited ranges are 8%–19% for ages 20–39, 11%–21% for ages 40–59, and 13%–24% for ages 60–79. These are general reference ranges rather than universal medical cutoffs.
What is the ideal body fat percentage for men?
There is no single ideal percentage for all men. A suitable level depends on age, fitness goals, muscle mass, fat distribution, medical history, performance needs, and whether the percentage can be maintained without harmful restriction.
Is 15% body fat good for a man?
Fifteen percent falls within the traditional fitness category and all three commonly cited adult age ranges. It is generally considered lean, but the number alone cannot confirm health.
Is 20% body fat healthy for a man?
Twenty percent is within the traditional average category. It also falls within the age-based reference ranges for men ages 40–79 but is one percentage point above the cited range for men ages 20–39.
Is 25% body fat considered obesity in men?
It depends on the classification. The traditional American Council on Exercise fitness chart labels 25% and higher as obesity. A newer outcome-based study proposed 25% as overweight-equivalent and 30% as obesity-equivalent for men. Neither chart should be used alone to diagnose an individual.
How accurate are body-fat smart scales?
Smart scales provide estimates rather than direct measurements. Hydration, recent meals, exercise, device design, and prediction equations may affect the result. They are generally more useful for monitoring consistent long-term trends than interpreting one measurement.
At what body fat percentage do men see abdominal muscles?
There is no guaranteed percentage. Abdominal definition depends on genetics, abdominal muscle development, fat distribution, skin characteristics, posture, lighting, and measurement accuracy. Some men see definition in the mid-teens, while others need a lower percentage.
Conclusion
A body fat percentage chart for men can provide useful context, but it should not become a pass-or-fail score. The commonly cited age ranges are 8%–19% for men ages 20–39, 11%–21% for ages 40–59, and 13%–24% for ages 60–79.
Use the same measurement method consistently, watch long-term trends, and consider waist size, muscle strength, fitness, laboratory results, and overall well-being. When a number is concerning or conflicts with other health information, discuss it with a healthcare professional rather than relying on the chart alone.
This content is for informational purposes only and not medical advice.
References
- Healthy Percentage Body Fat Ranges: An Approach for Developing Guidelines Based on Body Mass Index — PubMed
- Body Composition Data for Individuals 8 Years and Older: U.S. Population, 1999–2004 — CDC/NCHS
- Anthropometric Measurements and Body-Fat Categories — American Council on Exercise
- Defining Overweight and Obesity by Percent Body Fat — Endocrine Society
- Definition and Diagnostic Criteria of Clinical Obesity — The Lancet Diabetes & Endocrinology
- Obesity and Overweight Fact Sheet — World Health Organization
- Physical Activity Guidelines for Adults — CDC