
The updated ASCVD risk score chart classifies 10-year risk as low below 3%, borderline from 3% to under 5%, intermediate from 5% to under 10%, and high at 10% or higher. These categories come from the 2026 ACC/AHA dyslipidemia guideline, which recommends the newer PREVENT-ASCVD equations instead of the older Pooled Cohort Equations for many primary-prevention cholesterol decisions.
Your percentage estimates the likelihood of having a fatal or nonfatal heart attack or stroke within the next 10 years compared with people who have similar health characteristics. It helps guide conversations about lifestyle changes, cholesterol-lowering medication and additional testing, but it does not diagnose heart disease or guarantee that an event will or will not happen.
The American College of Cardiology and American Heart Association 2026 dyslipidemia guideline update, published March, 2026, introduced the lower PREVENT-ASCVD thresholds shown below.
Updated ASCVD Risk Score Chart
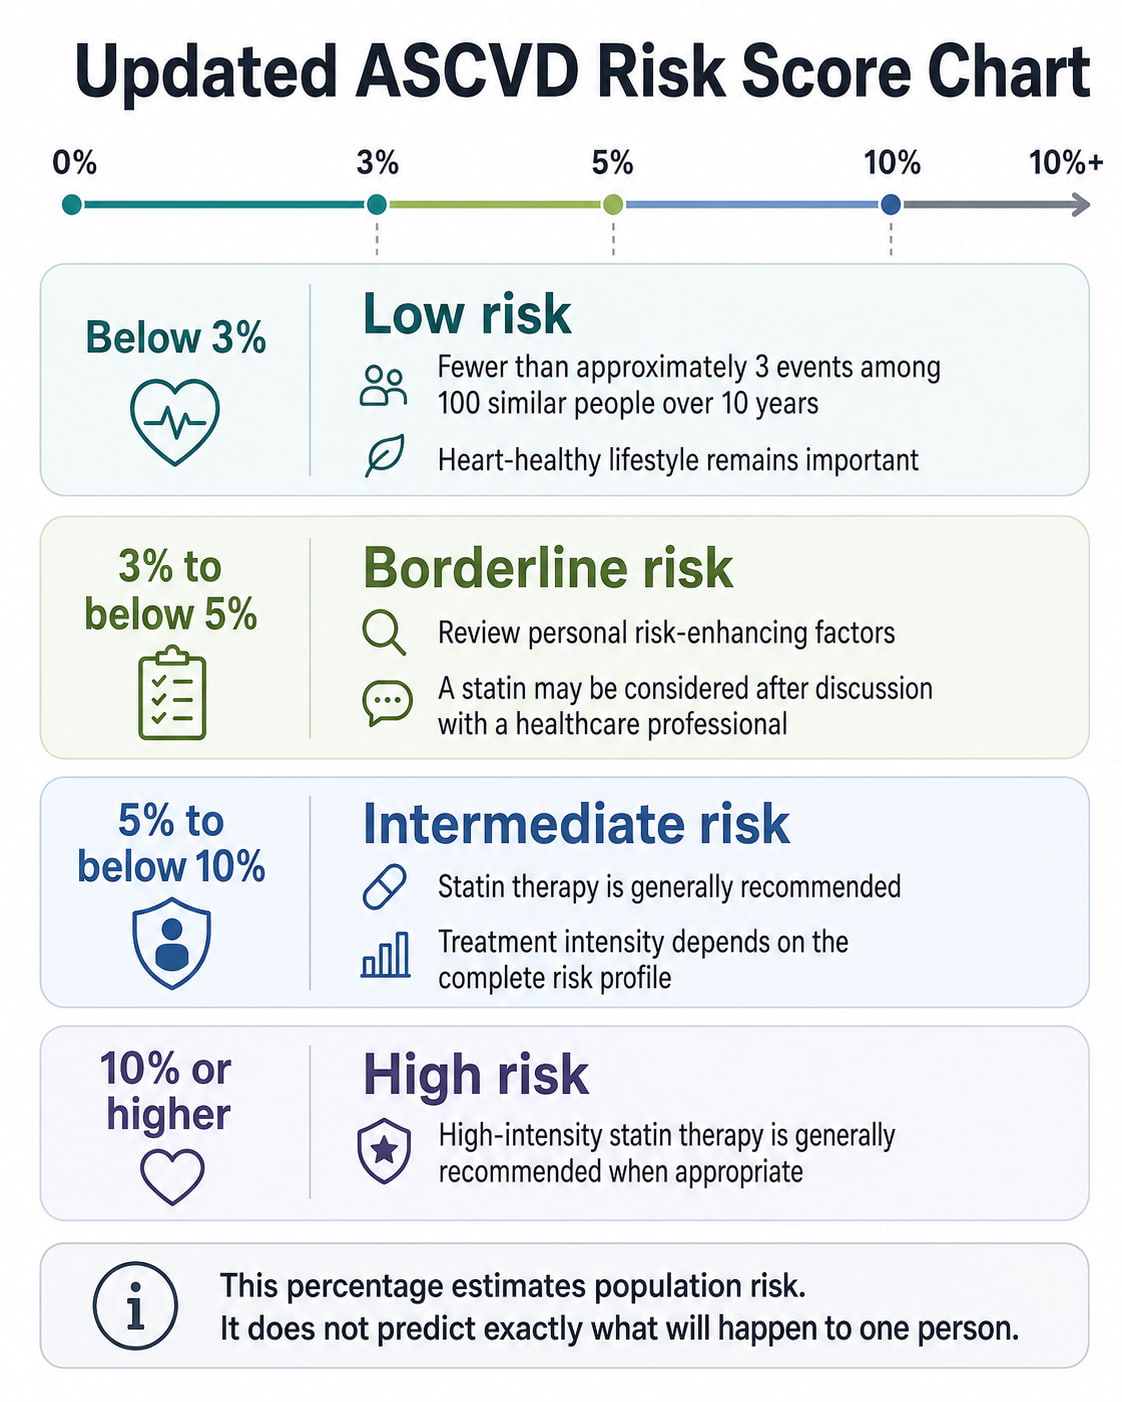
| Risk category | PREVENT-ASCVD 10-year risk | What the percentage means | General 2026 guidance |
|---|---|---|---|
| Low risk | Below 3% | Fewer than approximately 3 of every 100 similar people may experience an ASCVD event within 10 years | Emphasize heart-healthy habits. A statin may be reasonable for selected adults ages 30–59 with LDL-C of 160–189 mg/dL or a 30-year ASCVD risk of at least 10%. |
| Borderline risk | 3% to below 5% | Approximately 3 to fewer than 5 of every 100 | Review risk-enhancing factors. A moderate-intensity statin may be considered after a clinician-patient discussion. |
| Intermediate risk | 5% to below 10% | Approximately 5 to fewer than 10 of every 100 | Statin therapy is generally recommended. At least moderate-intensity therapy is commonly used, with greater lowering considered near the upper end of the range. |
| High risk | 10% or higher | At least approximately 10 of every 100 | High-intensity statin therapy is generally recommended unless it is contraindicated or not tolerated. |
The treatment column summarizes guideline recommendations rather than giving personal medical instructions. Medication decisions depend on your complete medical history, current LDL cholesterol, treatment tolerance, risk enhancers and preferences.
What Is an ASCVD Risk Score?
An ASCVD risk score estimates your chance of developing atherosclerotic cardiovascular disease over a specified period. Atherosclerosis is the buildup of cholesterol-containing plaque inside arteries.
For the PREVENT-ASCVD model, the estimated events include:
- Fatal or nonfatal heart attack
- Fatal or nonfatal stroke
A result of 6%, for example, does not mean that you personally have exactly a 6% chance of a heart attack. It means that approximately six cardiovascular events may occur over 10 years among 100 people with similar calculator inputs.
The score is best treated as a starting point for prevention planning—not as a pass-or-fail test.
What Changed in the 2026 ASCVD Risk Guidelines?
The 2026 guideline replaced the older Pooled Cohort Equations, commonly called PCE, with the more contemporary PREVENT-ASCVD equations for primary-prevention lipid decisions in appropriate adults.
PREVENT incorporates cardiovascular, kidney and metabolic health information. It was developed using data from more than 6.5 million diverse U.S. adults and does not include race as a calculator input. The older PCE used race-specific equations and was developed from older population data.
Old Versus Updated ASCVD Risk Levels
| Risk category | Older PCE categories | Updated PREVENT-ASCVD categories |
|---|---|---|
| Low | Below 5% | Below 3% |
| Borderline | 5% to below 7.5% | 3% to below 5% |
| Intermediate | 7.5% to below 20% | 5% to below 10% |
| High | 20% or higher | 10% or higher |
The two systems are not directly interchangeable. A 10% result from the older PCE model is not necessarily equivalent to a 10% PREVENT-ASCVD result because the models use different variables, data and calculations.
The ACC’s current CVD Risk Estimator Plus still allows comparison with the older model, but it states that PCE-based 10-year risk magnitude is no longer supported by current ACC clinical policy for dyslipidemia decisions.
Who Should Use the PREVENT-ASCVD Calculator?
PREVENT-ASCVD is designed primarily for adults who:
- Are 30–79 years old
- Do not have diagnosed cardiovascular disease
- Do not have known subclinical atherosclerosis
- Have LDL cholesterol between 70 and 189 mg/dL
- Are being assessed for prevention of a first heart attack or stroke
A 30-year ASCVD estimate is also available for adults ages 30–59. This longer-term result can be useful for younger adults whose immediate risk is low but whose lifetime exposure to high cholesterol, elevated blood pressure or other risk factors may still be important.
When the Score Is Not the Main Treatment Tool
A standard 10-year primary-prevention score may not be appropriate or may not determine treatment by itself when:
- You already have coronary artery disease, peripheral artery disease, a previous heart attack or an ischemic stroke.
- Your LDL-C is 190 mg/dL or higher.
- You are younger than 30 or older than 79.
- You have known plaque or coronary artery calcium.
- You are being evaluated for secondary prevention after an ASCVD event.
For LDL-C of 190 mg/dL or higher, the guideline generally recommends maximally tolerated statin therapy regardless of the calculated PREVENT-ASCVD percentage.
How Is the ASCVD Risk Score Calculated?
The current PREVENT calculator combines several factors that influence cardiovascular risk.
Required Calculator Inputs
The calculator asks for:
- Age
- Sex
- Total cholesterol
- HDL cholesterol
- Systolic blood pressure
- Current smoking status
- Body mass index
- Estimated glomerular filtration rate, or eGFR
- Diabetes status
- Use of cholesterol-lowering medication
- Use of blood pressure medication
The official calculator currently accepts the following numerical ranges:
| Input | Accepted range |
|---|---|
| Age | 30–79 years |
| Total cholesterol | 130–320 mg/dL |
| HDL cholesterol | 20–100 mg/dL |
| Systolic blood pressure | 90–200 mm Hg |
| BMI | 18.5–39.9 kg/m² |
| eGFR | 15–140 mL/min/1.73 m² |
Optional Inputs
Three optional details may further personalize the estimate:
- Urine albumin-to-creatinine ratio, or UACR
- Hemoglobin A1c
- U.S. ZIP code, which may be used to estimate the Social Deprivation Index
A missing optional value does not prevent calculation. However, including UACR or A1c may meaningfully change the result for some people with kidney disease or diabetes.
How to Interpret Each ASCVD Risk Category
Low ASCVD Risk: Below 3%
A score below 3% is considered low 10-year risk under the updated chart.
Most people in this group should focus on maintaining or improving:
- Blood pressure
- Cholesterol levels
- Physical activity
- Nutrition
- Sleep
- Tobacco avoidance
- Blood sugar management
Low short-term risk does not always mean low long-term risk. For adults ages 30–59, a clinician may review the 30-year score. Moderate-intensity statin therapy may be reasonable when LDL-C is 160–189 mg/dL or 30-year risk reaches 10%, even when the 10-year result remains below 3%.
Borderline ASCVD Risk: 3% to Below 5%
Borderline risk is the range in which individual circumstances often matter most.
The guideline supports considering moderate-intensity statin therapy after reviewing:
- Family history
- Other medical conditions
- Lipid biomarkers
- Long-term cholesterol exposure
- Potential benefits and side effects
- Personal treatment preferences
For borderline risk, the recommended LDL-C response—when medication is chosen—is generally a reduction of approximately 30%–49%, with an LDL-C goal below 100 mg/dL and non-HDL-C below 130 mg/dL.
Intermediate ASCVD Risk: 5% to Below 10%
Intermediate risk generally supports starting statin therapy after a clinician-patient discussion.
At least moderate-intensity statin therapy is recommended. High-intensity treatment may provide additional benefit when the score is near the upper end of the range or when other risk factors are present.
The general goal is a 30%–49% LDL-C reduction, although a reduction of at least 50% may be beneficial toward the upper end of intermediate risk.
High ASCVD Risk: 10% or Higher
A PREVENT-ASCVD score of 10% or higher is classified as high risk.
High-intensity statin therapy is generally recommended, with goals that commonly include:
- LDL-C reduction of at least 50%
- LDL-C below 70 mg/dL
- Non-HDL-C below 100 mg/dL
These goals may require a statin alone or, in selected cases, additional cholesterol-lowering medication. Medication choice depends on baseline cholesterol, response, side effects, other conditions and cost or access considerations.
Risk-Enhancing Factors That May Change the Decision
The percentage does not capture every factor associated with ASCVD. The 2026 guideline recommends a Calculate, Personalize and Reclassify approach.
Risk-enhancing factors may include:
- A family history of premature ASCVD
- Persistently high LDL cholesterol
- Persistently elevated triglycerides
- Chronic kidney disease
- Chronic inflammatory diseases, such as rheumatoid arthritis or lupus
- Preeclampsia
- Gestational diabetes
- Premature menopause
- South Asian, Filipino or another higher-risk ancestry
- Elevated lipoprotein(a)
- Elevated apolipoprotein B
- Elevated high-sensitivity C-reactive protein
The American Heart Association’s 2026 dyslipidemia guideline overview recommends measuring lipoprotein(a), or Lp(a), at least once in adulthood. An Lp(a) level of at least 125 nmol/L or 50 mg/dL is considered a risk-enhancing factor.
When a Coronary Artery Calcium Scan May Help
A coronary artery calcium, or CAC, scan is a low-dose CT test that detects calcified plaque in the coronary arteries.
It may be helpful when:
- Your result is borderline or intermediate.
- You are uncertain about starting a statin.
- Your calculated risk and other health factors point in different directions.
- The result would realistically change your treatment decision.
The 2026 guideline supports selective CAC testing in men age 40 or older and women age 45 or older when risk or treatment remains uncertain.
A CAC result should not be ordered automatically for everyone. It adds cost and a small amount of radiation, so it is most useful when the answer could change care.
PREVENT-ASCVD, PREVENT-CVD and PREVENT-HF Are Different
The PREVENT calculator can display three related estimates:
| Calculator model | Events included | Common use |
|---|---|---|
| PREVENT-ASCVD | Heart attack and stroke | Cholesterol and lipid-management decisions |
| PREVENT-HF | Heart failure | Estimating heart-failure risk |
| PREVENT-CVD | ASCVD plus heart failure | Total cardiovascular risk, including some blood pressure decisions |
Choose PREVENT-ASCVD when using the risk categories in this article.
This distinction explains why some current guidance still mentions a 7.5% threshold. The 2025 blood pressure guideline uses a 10-year PREVENT-CVD threshold of 7.5% for certain adults with stage 1 hypertension. That is not the same as the PREVENT-ASCVD cholesterol chart, where 5% begins the intermediate category and 10% begins the high category.
How to Use the Official ASCVD Calculator
The American Heart Association PREVENT calculator is intended to support conversations between clinicians and patients.
To obtain the most useful result:
- Use recent blood pressure and laboratory values.
- Enter your actual medication status.
- Select the ASCVD model for cholesterol-related decisions.
- Add UACR or A1c when available and relevant.
- Check whether the result is 10-year or 30-year risk.
- Review the percentage with a qualified healthcare professional.
- Discuss risk enhancers and whether CAC testing would add useful information.
Do not change your numbers to simulate what medication might do unless the tool provides a specific treatment-scenario feature. Entering an assumed blood pressure or cholesterol value can produce a misleading estimate.
Example of Reading an ASCVD Score
Suppose an adult receives a PREVENT-ASCVD result of 6.2%.
That result falls into the intermediate-risk category because it is:
- At least 5%
- Below 10%
It can be described as approximately six ASCVD events over 10 years among 100 people with similar characteristics.
The next step is not simply to accept or reject medication. A clinician may review LDL-C, family history, kidney health, Lp(a), inflammatory conditions, treatment preferences and whether a CAC scan would resolve uncertainty.
If the same person instead received a PREVENT-CVD result of 6.2%, the ASCVD chart could not be applied because PREVENT-CVD includes heart failure as well as heart attack and stroke.
How to Support a Lower Cardiovascular Risk
A risk estimate may change over time as modifiable factors improve or worsen. Practical prevention priorities include:
- Do not smoke, and seek structured help to stop when needed.
- Keep blood pressure within the range recommended by your clinician.
- Emphasize vegetables, fruits, beans, whole grains, nuts, fish and unsaturated fats.
- Limit trans fats, excessive saturated fat, highly processed foods and excess sodium.
- Obtain regular aerobic and muscle-strengthening activity appropriate for your health.
- Manage diabetes and chronic kidney disease with professional care.
- Take prescribed medication consistently and report side effects rather than stopping it without guidance.
- Maintain regular follow-up for cholesterol, blood pressure and other relevant tests.
Lifestyle habits remain important at every risk level, including for people taking cholesterol-lowering medication.
Limitations of the ASCVD Risk Score
The ASCVD score is useful, but it has important limitations:
- It predicts risk for groups of similar people rather than an exact individual outcome.
- Small differences near a cutoff should not be overinterpreted.
- It may underestimate risk when important risk enhancers are not included.
- It was developed using U.S. data and may perform differently in other countries.
- It does not replace examination, laboratory interpretation or clinical judgment.
- It does not determine whether a specific medication is safe for you.
- It should not be used to diagnose an artery blockage.
Pregnancy, medication interactions, frailty, serious illness, life expectancy and previous medication reactions can also affect treatment decisions.
Frequently Asked Questions
What is a good ASCVD risk score in 2026?
A 10-year PREVENT-ASCVD score below 3% is classified as low risk. However, a low result does not automatically mean that no prevention is needed. LDL-C, long-term risk, family history and other risk enhancers still matter.
Is a 5% ASCVD risk high?
No. Under the updated PREVENT-ASCVD chart, exactly 5% is intermediate risk, not high risk. High risk begins at 10%.
What does a 10% ASCVD risk mean?
It means that approximately 10 ASCVD events may occur within 10 years among 100 people with similar calculator characteristics. It does not mean that an individual event is certain. A result of 10% is classified as high PREVENT-ASCVD risk.
Is the 7.5% ASCVD threshold still used?
The older PCE chart used 7.5% as the beginning of intermediate risk. The 2026 dyslipidemia guideline instead uses PREVENT-ASCVD categories of 3%, 5% and 10%.
A separate 7.5% PREVENT-CVD threshold is used in certain blood pressure decisions, but PREVENT-CVD includes heart failure and should not be confused with PREVENT-ASCVD.
Can someone with a low score still need a statin?
Yes. An adult may still be considered for statin therapy because of very high LDL-C, diabetes, chronic kidney disease, HIV, a high 30-year risk or another major risk enhancer.
For example, maximally tolerated statin therapy is generally recommended when LDL-C is at least 190 mg/dL regardless of the calculated 10-year percentage.
Does the PREVENT calculator use race?
No. PREVENT does not use race as a calculator input. It incorporates cardiovascular, kidney and metabolic health factors and allows certain optional variables to personalize the result.
Ancestry may still be discussed separately as a potential risk-enhancing factor because some populations have cardiovascular risks that are not fully represented by the base equation.
Can I calculate my ASCVD risk myself?
You can enter your information into an official calculator, but the tool is intended to support clinician-patient discussions. A healthcare professional can confirm that the correct model was selected, interpret borderline results and identify factors the calculator does not include.
Conclusion
The updated ASCVD risk score chart uses four PREVENT-ASCVD categories: low below 3%, borderline from 3% to under 5%, intermediate from 5% to under 10%, and high at 10% or higher.
Your score is most useful when it is combined with your cholesterol results, blood pressure, kidney and metabolic health, family history and personal preferences. Use an official calculator with current information, then discuss the result with your healthcare professional before making medication or testing decisions.
This content is for informational purposes only and not medical advice.