
A real height and weight chart by age is not one single chart for every stage of life. Babies and toddlers are assessed with WHO growth standards, children and teens with CDC growth charts and BMI-for-age percentiles, and adults with BMI-based height and weight ranges. Seniors often need that number interpreted alongside muscle loss, waist size, appetite, and any unexplained weight change. Understanding which chart applies at each age helps you judge growth and weight more accurately and know when a number deserves closer attention.
Recent national data show how important this topic is. The Centers for Disease Control and Prevention (CDC) reports that obesity affected 40.3% of U.S. adults in 2021–2023, and CDC childhood obesity data show obesity affected 19.7% of children and adolescents ages 2 to 19 in the most recent pre-pandemic national estimate. Using the correct chart does not diagnose a condition, but it can help flag when a child’s growth pattern, an adult’s weight, or a senior’s weight change should be reviewed more closely.
Safety note: Growth charts and BMI are screening tools, not diagnoses. In children, repeated measurements and the overall growth pattern matter more than one isolated number. In adults and seniors, sudden unexplained weight loss, very low weight, or a rapidly rising waist size deserves medical review. This content is for informational purposes only and not medical advice.
How to Use a Height and Weight Chart by Age
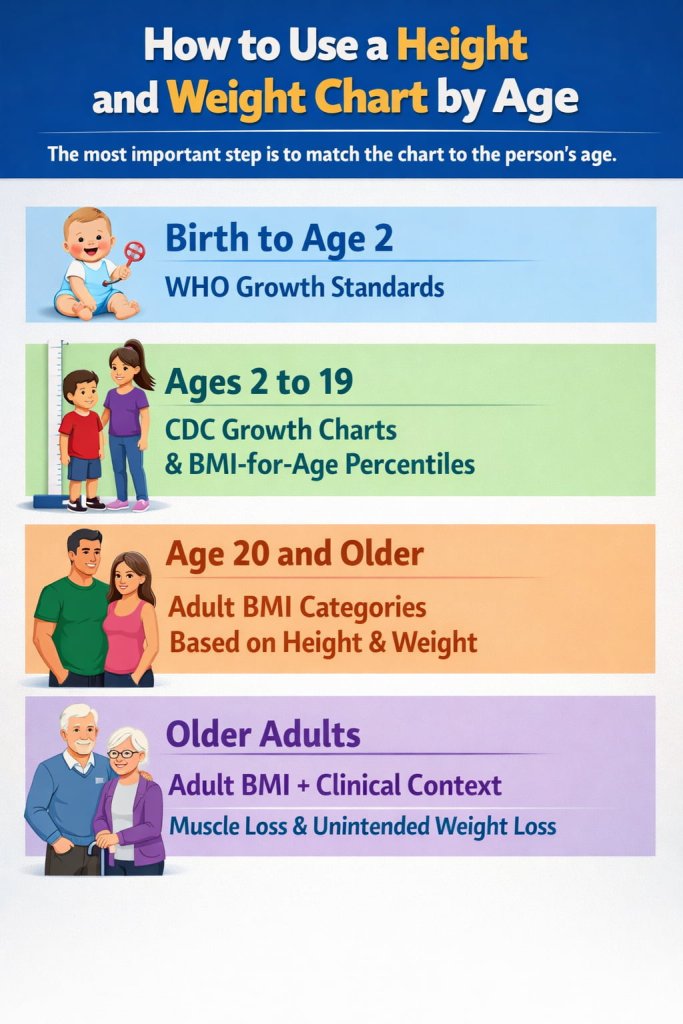
The most important step is to match the chart to the person’s age:
- Birth to age 2: WHO growth standards
- Ages 2 to 19: CDC growth charts and BMI-for-age percentiles
- Age 20 and older: Adult BMI categories based on height and weight
- Older adults: Adult BMI plus clinical context, especially muscle loss and unintended weight loss
That is why one “ideal weight by age” chart can be misleading. A baby’s growth is tracked differently from a teenager’s, and an older adult’s healthy-weight discussion often goes beyond the number on the scale.
Height and Weight Chart by Age for Babies and Toddlers (Birth to 2 Years)
For infants and toddlers, clinicians use the World Health Organization Child Growth Standards along with CDC guidance on which charts to use at different ages. These charts focus on weight-for-age, length-for-age, and weight-for-length, which gives a better picture of early growth than adult-style weight charts do. CDC specifically notes that BMI-for-age is not recommended for children younger than 2 years.
At this age, the goal is not to compare your child with an “ideal weight” number. It is to see whether growth is following a reasonable pattern over time. A percentile shows how a child compares with other children of the same age and sex, but one percentile by itself does not diagnose a problem. Growth charts are tools that help form a bigger clinical picture.
What matters most under age 2
For babies and toddlers, clinicians usually pay attention to:
- steady gains in weight and length over time
- weight-for-length rather than BMI
- feeding history, medical history, and overall development
- whether the child was born preterm or has another medical condition that affects growth
One more measure matters in babies and toddlers: head circumference-for-age. CDC’s clinical growth-chart set for this age group includes separate boys’ and girls’ curves for head circumference, weight-for-length, length-for-age, and weight-for-age. Under WHO-based guidance for children younger than 2, possible low or high growth patterns are commonly flagged around the 2nd and 98th percentiles, which is different from the percentile language many parents hear for older children. That is one reason infant growth charts are best interpreted by a clinician rather than compared casually with older-child or adult charts.
Height and Weight Chart by Age for Children and Teens (Ages 2 to 19)
From age 2 onward, the standard U.S. tool is the CDC growth-chart system for children and adolescents. These charts include stature-for-age, weight-for-age, and BMI-for-age. For children with very high BMI values, CDC also provides extended BMI-for-age growth charts to better monitor values above the 97th percentile.
For this age group, weight is not judged by adult BMI cutoffs. Instead, BMI is compared with other children of the same age and sex. That is why a healthy weight for kids and teens is expressed as a percentile range, not as one universal number.
A common point of confusion happens right around a child’s second birthday. CDC recommends switching from the WHO charts to the CDC growth charts at age 2, and the plotted value can shift a little because providers also switch from measuring recumbent length to standing height at that age. The charts are also sex-specific, so boys and girls are always plotted on separate growth charts.
The official child and teen BMI categories from the CDC child and teen BMI categories page are:
| BMI-for-age category | Percentile |
|---|---|
| Underweight | Below the 5th percentile |
| Healthy weight | 5th percentile to below the 85th percentile |
| Overweight | 85th percentile to below the 95th percentile |
| Obesity | 95th percentile or greater |
| Severe obesity | 120% of the 95th percentile or BMI 35 kg/m² or greater |
A child does not need to be at the 50th percentile for height or weight to be healthy. Many healthy children are naturally above or below the midpoint. What matters more is whether the child is following a generally consistent curve and whether the height, weight, and BMI pattern makes sense together.
Height and Weight Chart by Age for Adults (Age 20 and Older)
For adults, there is no official U.S. chart that says you should weigh a specific number at a specific age. Instead, adults are usually screened with body mass index, or BMI, which compares weight to height. According to the CDC adult BMI information, the standard adult categories are:
- Underweight: below 18.5
- Healthy weight: 18.5 to below 25
- Overweight: 25 to below 30
- Obesity: 30 or greater
BMI is useful, but it is not the whole story. CDC describes BMI as a screening measure, not a diagnosis. That means it helps identify possible risk, but it does not directly measure body fat, muscle mass, or health status on its own.
Adult Height and Weight Chart by Height
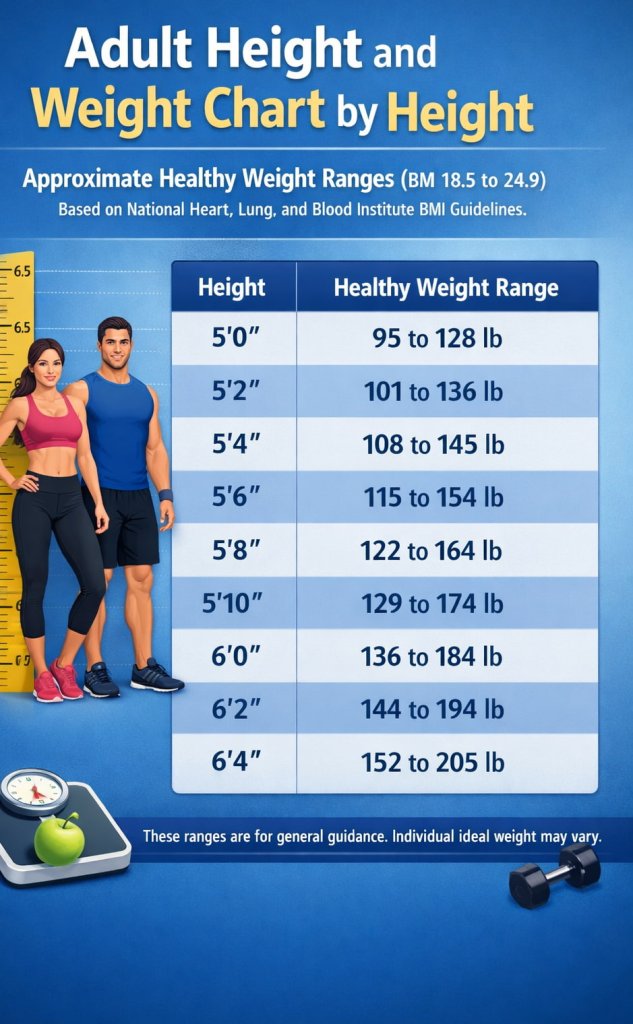
The chart below shows approximate healthy adult weight ranges based on a BMI of 18.5 to 24.9, using the National Heart, Lung, and Blood Institute BMI table. These are practical screening ranges, not exact target weights for every body type.
| Height | Approximate healthy weight range |
|---|---|
| 5’0″ | 95 to 128 lb |
| 5’2″ | 101 to 136 lb |
| 5’4″ | 108 to 145 lb |
| 5’6″ | 115 to 154 lb |
| 5’8″ | 122 to 164 lb |
| 5’10” | 129 to 174 lb |
| 6’0″ | 136 to 184 lb |
| 6’2″ | 144 to 194 lb |
| 6’4″ | 152 to 205 lb |
Another useful screening tool for adults is waist circumference. The CDC healthy weight guidance notes that health risk is higher when waist size is more than 35 inches in women or more than 40 inches in men. To measure it, place a tape measure around your abdomen just above the hip bones and check the number after you breathe out normally.
It also helps to note one important exception: pregnancy uses different weight guidance. During pregnancy, weight goals are based on prepregnancy BMI and prenatal guidance, not the standard adult height-and-weight chart.
This kind of adult chart is helpful for quick screening, but it can overestimate risk in some people with a very muscular build and underestimate risk in people who carry more abdominal fat or have lost muscle mass. That is why BMI works best when used with waist size, medical history, blood pressure, and lab results rather than by itself.
Height and Weight Chart by Age for Seniors
There is no separate official U.S. healthy-weight chart just for seniors. Older adults are still often screened with adult BMI ranges, but that number needs more context. In later life, being underweight, losing muscle, or having unexplained weight loss can be just as important as having a high BMI.
The National Institute on Aging notes that low weight in older adults can raise the risk of problems such as osteoporosis and anemia, and sudden unintended weight loss can point to a serious medical issue. MedlinePlus guidance on unintentional weight loss advises medical review when someone loses 10 pounds or 5% of usual body weight over 6 to 12 months without trying.
What makes senior weight assessment different
Older adults may need a closer look when they have:
- low BMI or noticeable frailty
- unintended weight loss
- shrinking muscle mass or declining strength
- difficulty eating, chewing, shopping, or preparing food
- chronic illness that affects appetite or absorption
For many seniors, the most useful questions are not only “What do I weigh?” but also “Have I lost weight without trying?” and “Am I losing strength or appetite?”
Why There Is No One Perfect Height and Weight Number at Every Age
The phrase “height and weight chart by age” sounds simple, but healthcare professionals do not use one universal chart because body assessment changes with growth and aging.
A toddler is still establishing early growth patterns. A child or teen is moving through growth spurts and puberty. An adult’s weight is screened against height. An older adult may have lower muscle mass even when the scale has not changed much. The right chart depends on age, and the same number can mean different things at different life stages.
How to Measure Height and Weight Correctly at Home
Accurate measurements matter. Even small errors can change a child’s percentile result or make an adult chart less useful.
For the most practical home measurements:
- use a digital scale on a hard, level floor
- weigh at about the same time of day
- remove shoes and heavy clothing
- stand straight against a wall or stadiometer for height
- record the date so you can track trends, not just one reading
For children, home measurements can be helpful, but office measurements are usually the best basis for growth-chart tracking. For adults and seniors, repeated measurements over time are often more informative than one random weigh-in.
When to Talk to a Clinician
A healthcare professional should review the numbers when:
- a baby or child crosses growth percentiles quickly
- a child’s height gain slows noticeably
- a child’s BMI falls into the underweight, overweight, obesity, or severe-obesity range
- an adult has a very low or very high BMI
- a senior has unplanned weight loss, reduced appetite, weakness, or frailty
That does not always mean something is seriously wrong. It means the chart has done its job by flagging a pattern that deserves a more complete review.
FAQs
Is there one healthy height and weight chart by age for everyone?
No. Babies and toddlers use WHO growth standards, children and teens use CDC growth charts and BMI-for-age percentiles, and adults use BMI-based height and weight screening. Seniors still use adult BMI ranges, but clinicians also consider muscle loss and unintended weight change.
What percentile is a healthy weight for a child?
In CDC charts, healthy weight for children and teens means a BMI-for-age from the 5th percentile to below the 85th percentile.
Is BMI enough for adults?
Not always. BMI is a screening tool, and waist size adds useful information about risk, especially abdominal fat.
Why can seniors look normal on the scale but still need attention?
Because older adults can lose muscle, strength, or appetite without dramatic weight changes. Unexplained weight loss is especially important to check.
Bottom Line
A good height and weight chart by age helps only when you use the right chart for the right age group. Babies and toddlers should be tracked with WHO growth standards. Kids and teens should be assessed with CDC growth charts and BMI-for-age percentiles. Adults can use BMI-based height and weight ranges as a starting point. Seniors need a broader view that includes strength, appetite, muscle loss, and unintended weight change.
If the numbers seem off or the trend changes suddenly, bring them to a pediatrician or healthcare professional rather than trying to judge everything from one chart alone.
Sources/References
- Centers for Disease Control and Prevention — What Growth Charts Are Recommended?
- World Health Organization — Child Growth Standards
- Centers for Disease Control and Prevention — CDC Growth Charts
- Centers for Disease Control and Prevention — Child and Teen BMI Categories
- Centers for Disease Control and Prevention — Healthy Weight