
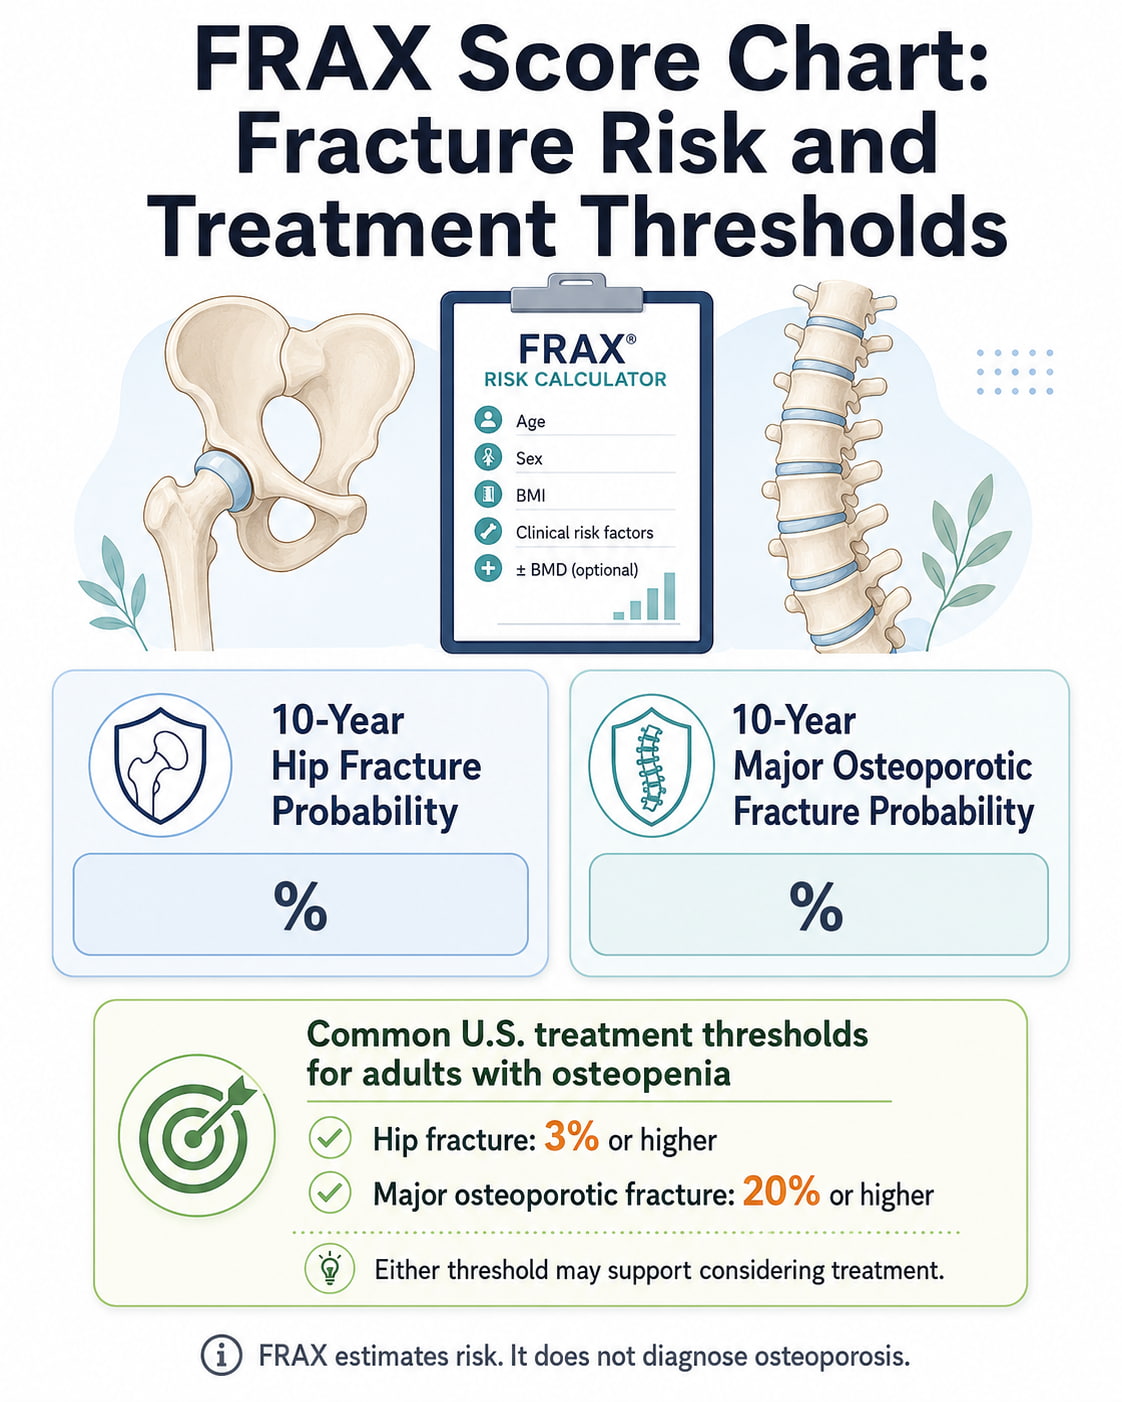
A FRAX score estimates your chance of having a hip fracture or major osteoporotic fracture during the next 10 years. In the United States, osteoporosis medication is commonly considered when the 10-year hip fracture probability is 3% or higher or the major osteoporotic fracture probability is 20% or higher in an adult with low bone mass.
However, FRAX does not have one universal “normal” range. Treatment thresholds vary by country, and a result must be interpreted alongside bone density, previous fractures, fall risk, medications, and other health factors.
You can calculate a result through the official FRAXplus calculator, which currently displays FRAX version 1.4.9 as of July 2026.
FRAX Score Chart at a Glance
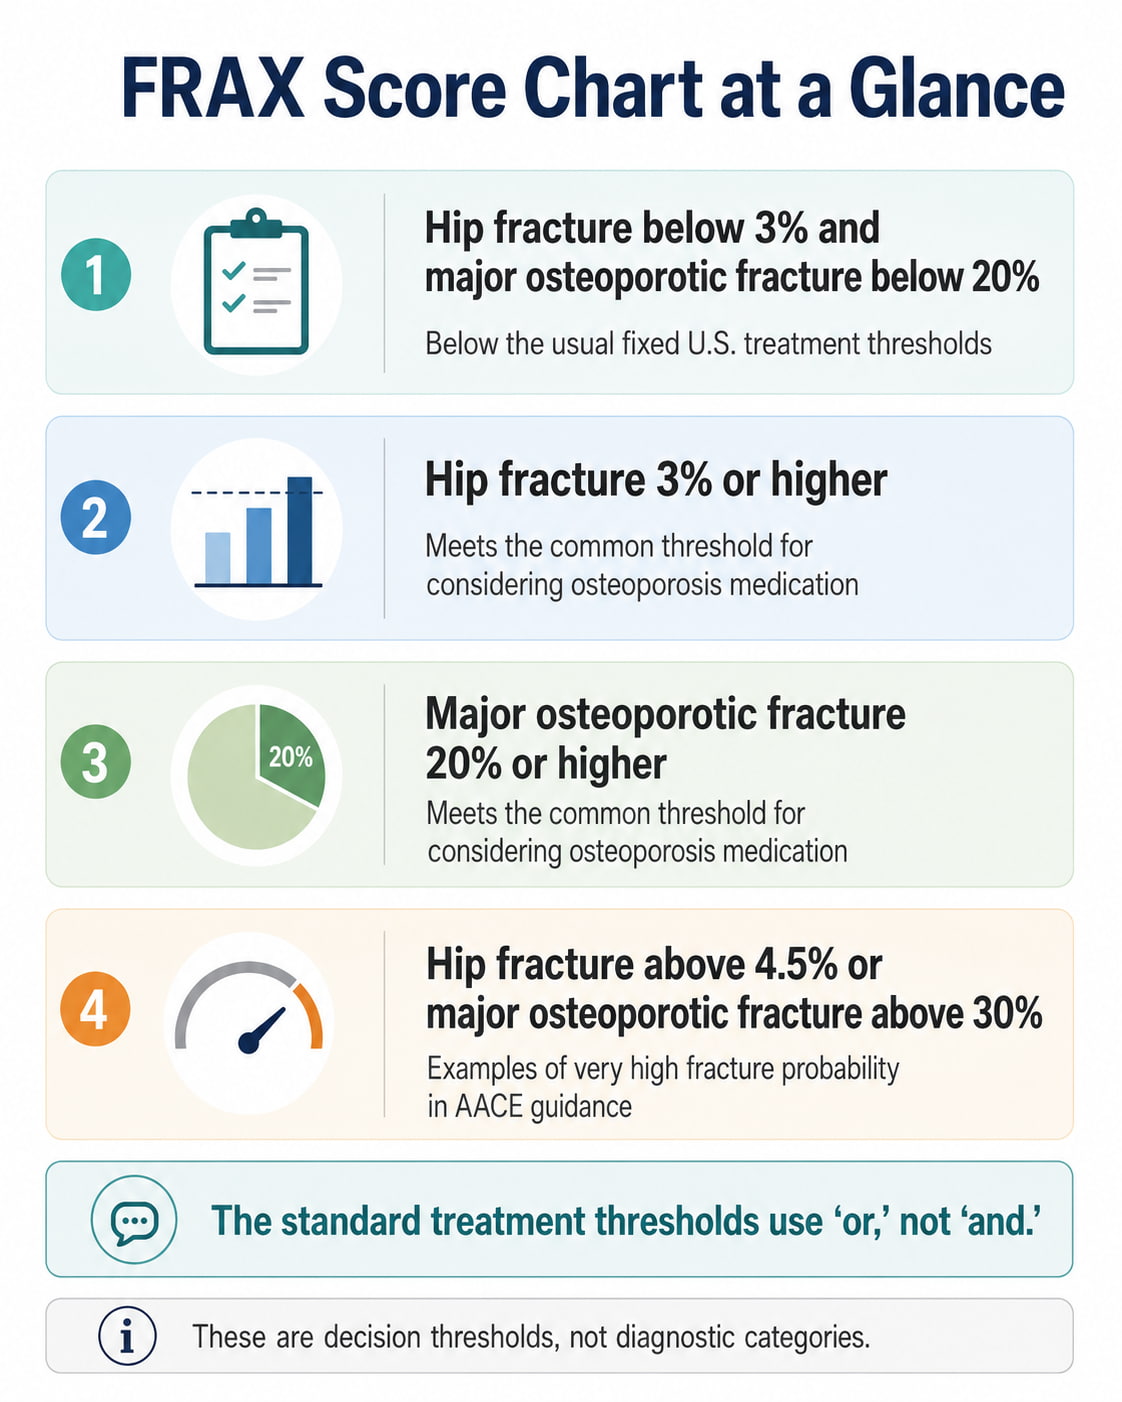
The following chart shows the commonly used U.S. treatment thresholds for postmenopausal women and men age 50 or older who have osteopenia.
| 10-year FRAX result | Common U.S. interpretation |
|---|---|
| Hip fracture below 3% and major osteoporotic fracture below 20% | Below the usual fixed FRAX treatment thresholds |
| Hip fracture 3% or higher | Meets the common threshold for considering osteoporosis medication |
| Major osteoporotic fracture 20% or higher | Meets the common threshold for considering osteoporosis medication |
| Hip fracture above 4.5% | One AACE example of very high fracture probability |
| Major osteoporotic fracture above 30% | One AACE example of very high fracture probability |
The standard treatment thresholds use “or,” not “and.” A person may meet the threshold because either the hip fracture percentage or the major osteoporotic fracture percentage is high enough.
These numbers are decision thresholds, not diagnostic categories. A result below 3% and 20% does not guarantee that treatment is unnecessary, while a result above a threshold does not automatically determine which medication should be used.
What Does a FRAX Score Mean?
FRAX provides two separate percentages.
10-Year Hip Fracture Probability
This percentage estimates the chance of experiencing a hip fracture during the next 10 years.
For example, a hip fracture score of 4% means that approximately 4 out of 100 people with similar risk factors may experience a hip fracture over that period. It does not mean that the individual will definitely have a fracture.
10-Year Major Osteoporotic Fracture Probability
This percentage estimates the chance of experiencing at least one of the following fractures:
- Hip fracture
- Clinical spine fracture
- Distal forearm fracture
- Proximal humerus or shoulder fracture
It does not include every possible fragility fracture, such as all rib, pelvic, ankle, or foot fractures.
U.S. FRAX Treatment Thresholds
The Bone Health and Osteoporosis Foundation supports considering pharmacologic treatment for postmenopausal women and men age 50 or older who have low bone mass and either:
- A 10-year hip fracture probability of 3% or higher
- A 10-year major osteoporotic fracture probability of 20% or higher
Low bone mass, also called osteopenia, generally means a T-score between −1.0 and −2.5 at the femoral neck or total hip.
Example 1: Hip Risk Reaches the Threshold
- Hip fracture probability: 3.6%
- Major osteoporotic fracture probability: 15%
This result reaches the common U.S. treatment threshold because the hip probability is at least 3%, even though the major fracture probability is below 20%.
Example 2: Major Fracture Risk Reaches the Threshold
- Hip fracture probability: 2.1%
- Major osteoporotic fracture probability: 22%
This result reaches the threshold because the major osteoporotic fracture probability is at least 20%.
Example 3: Both Percentages Are Below the Threshold
- Hip fracture probability: 1.8%
- Major osteoporotic fracture probability: 12%
This result is below both fixed U.S. thresholds. A clinician may still recommend treatment when other important risk factors are present.
Treatment May Be Recommended Without a High FRAX Score
FRAX is not required in every osteoporosis treatment decision. Medication may be recommended even when the percentages are below 3% and 20%.
Previous Hip or Vertebral Fracture
A hip or vertebral fragility fracture can be sufficient reason to consider osteoporosis treatment regardless of the current T-score or FRAX result.
A fragility fracture generally occurs from a level of trauma that would not normally break healthy bone, such as falling from standing height.
T-Score of −2.5 or Lower
A T-score of −2.5 or lower at the lumbar spine, femoral neck, or total hip meets the bone-density criterion for osteoporosis. Treatment may therefore be appropriate without relying on FRAX.
Other Fragility Fractures
Fractures of the pelvis, proximal humerus, or distal forearm may also influence treatment decisions, particularly when the person has osteopenia.
Recent or Multiple Fractures
A recent fracture can signal a high short-term risk of another fracture. Standard FRAX records previous fracture as a yes-or-no answer and does not fully represent how recently the fracture occurred or how many fractures a person has had.
What Is Considered a Very High FRAX Score?
The American Association of Clinical Endocrinology gives the following examples of very high fracture probability:
- Major osteoporotic fracture probability above 30%
- Hip fracture probability above 4.5%
These are not the basic U.S. thresholds for beginning treatment. They are examples used to identify people who may be at very high risk and may need a more intensive or specialist-led treatment plan.
AACE also considers other very-high-risk features, including:
- A fracture within the previous 12 months
- Multiple fractures
- A fracture while receiving osteoporosis medication
- A very low T-score, such as below −3.0
- Long-term use of medications that weaken bone
- A high risk of falling or a history of injurious falls
A person can therefore be classified as very high risk without exceeding both FRAX percentages.
How to Read a FRAX Score Correctly
1. Confirm the Country Model
FRAX calculations are calibrated using country-specific fracture and mortality data. Selecting the wrong country can produce a result that does not accurately represent the appropriate population.
2. Read Both Percentages
Do not focus only on the major osteoporotic fracture result. A person may have a hip fracture probability above the treatment threshold even when the major fracture probability remains below 20%.
3. Check Whether Bone Density Was Included
FRAX can be calculated with or without bone mineral density. When bone density is included, the calculator specifically uses the femoral neck measurement.
A lumbar spine, total hip, heel, wrist, or Z-score should not be entered in the femoral neck field.
4. Compare the Result With Local Guidelines
The calculator provides probabilities but does not decide who should receive treatment. The percentages must be compared with the treatment guidelines used in the person’s country.
5. Consider Risks That FRAX Does Not Fully Capture
Falls, recent fractures, diabetes, medication doses, and differences between spine and hip bone density can change the clinical interpretation.
What Information Is Used in a FRAX Calculation?
| FRAX input | What it represents |
|---|---|
| Age | Fracture probability generally changes with age |
| Sex | Used in the underlying fracture-risk model |
| Height and weight | Used to calculate body mass index |
| Previous fracture | An adult fracture associated with relatively low trauma |
| Parent fractured hip | Hip fracture in either parent |
| Current smoking | Current tobacco smoking |
| Glucocorticoid use | Current or previous oral steroid exposure meeting the FRAX definition |
| Rheumatoid arthritis | A confirmed diagnosis |
| Secondary osteoporosis | Certain conditions associated with bone loss |
| Alcohol intake | Three or more units per day |
| Femoral neck BMD | Optional bone-density input |
The answers must be accurate. Standard FRAX does not provide an “unknown” option for clinical risk factors. Leaving out a previous fracture, steroid exposure, or parental hip fracture may lower the estimated probability.
FRAX Score and T-Score: What Is the Difference?
FRAX and T-scores answer different questions.
| Measurement | What it tells you |
|---|---|
| FRAX score | Estimated 10-year fracture probability |
| T-score | How bone density compares with the average bone density of a healthy young adult |
| Z-score | How bone density compares with an age- and sex-matched reference population |
A person can have osteopenia rather than osteoporosis by T-score but still have a high FRAX probability because of age, prior fractures, smoking, glucocorticoid use, or other risk factors.
The reverse can also occur. A person with osteoporosis by T-score may have FRAX percentages below the fixed treatment thresholds. The osteoporosis-range T-score can still support treatment.
Why FRAX Thresholds Differ by Country
The 3% hip and 20% major fracture thresholds are commonly used in the United States. They should not be applied automatically in every country.
For example, the National Osteoporosis Guideline Group in the United Kingdom uses age-dependent intervention thresholds before age 70 and fixed thresholds beginning at age 70.
Under NOGG, the treatment threshold rises with age before becoming fixed. The higher of the hip fracture and major osteoporotic fracture risk categories is used when the two results disagree.
This explains why the same FRAX percentage may lead to different recommendations in the United States, United Kingdom, or another country.
When FRAX May Underestimate Fracture Risk
FRAX is useful, but it cannot represent every detail that affects bone strength and falls.
Frequent Falls
Falls are not entered as a standard yes-or-no FRAX risk factor. Someone who falls repeatedly may have more fracture risk than the result suggests.
Recent Fracture
A fracture during the previous one or two years can indicate an especially high near-term risk. Standard FRAX does not account directly for fracture recency.
Multiple Previous Fractures
The calculator records previous fracture as one yes-or-no answer. It does not fully distinguish one fracture from several fractures.
Type 2 Diabetes
Type 2 diabetes is not a standard FRAX input. Fracture risk may be underestimated in some people with diabetes.
High Glucocorticoid Doses
Standard FRAX does not fully reflect the dose-response relationship of oral glucocorticoids. Higher or prolonged doses can require clinical adjustment.
Lower Spine Density Than Hip Density
FRAX uses femoral neck bone density. It may underestimate risk when the lumbar spine T-score is substantially lower than the femoral neck T-score.
FRAXplus adjustment tools can illustrate the potential effect of recent or multiple fractures, falls, type 2 diabetes duration, higher glucocorticoid exposure, trabecular bone score, and spine–hip bone-density differences. The platform advises against applying several adjustments at once because the accuracy of combined adjustments has not been established.
Is FRAX a Diagnosis?
FRAX does not diagnose osteoporosis.
Osteoporosis may be identified through bone-density testing, certain fragility fractures, or other accepted clinical criteria. FRAX adds information about future fracture probability and can help guide decisions when a T-score alone does not provide the full picture.
The tool also does not select a medication, determine a dose, or replace an evaluation by a qualified healthcare professional.
Frequently Asked Questions
What is a good FRAX score?
There is no universal good or normal FRAX score. Lower percentages generally indicate lower estimated probability, but results must be compared with country-specific guidelines. In the United States, hip risk below 3% and major fracture risk below 20% are below the usual fixed treatment thresholds for adults with osteopenia.
Is a 3% hip fracture risk high?
A 3% 10-year hip fracture probability reaches the common U.S. treatment threshold for postmenopausal women and men age 50 or older with low bone mass. It is not a universal definition of high risk in every country.
What does a 20% FRAX score mean?
A 20% major osteoporotic fracture probability means that approximately 20 out of 100 people with similar characteristics may experience a hip, clinical spine, distal forearm, or proximal humerus fracture within 10 years.
Can FRAX be calculated without a bone-density test?
Yes. FRAX can calculate fracture probability using clinical risk factors and body mass index without bone mineral density. Adding femoral neck BMD may improve risk classification when a DXA result is available.
Can FRAX be used for people already taking osteoporosis medication?
FRAX is not sensitive enough to monitor treatment success or establish treatment targets. It may sometimes be used in a treated person when a clinician is considering a change in therapy, but changes in FRAX percentages should not be used alone to judge whether medication is working.
Does a low FRAX score mean my bones are healthy?
Not necessarily. FRAX can be below treatment thresholds even when a person has osteoporosis by T-score, a previous hip or vertebral fracture, frequent falls, or another important risk factor. FRAX must be interpreted with the full clinical picture.
Conclusion
A FRAX score chart helps place 10-year hip and major osteoporotic fracture probabilities into context. In the United States, the most familiar treatment thresholds are 3% for hip fracture and 20% for major osteoporotic fracture in adults with osteopenia.
These percentages are starting points for discussion, not automatic treatment rules. Review the result with a healthcare professional who can consider your bone-density measurements, fracture history, fall risk, medications, health conditions, and local guidelines before recommending the next step.
This content is for informational purposes only and not medical advice.