
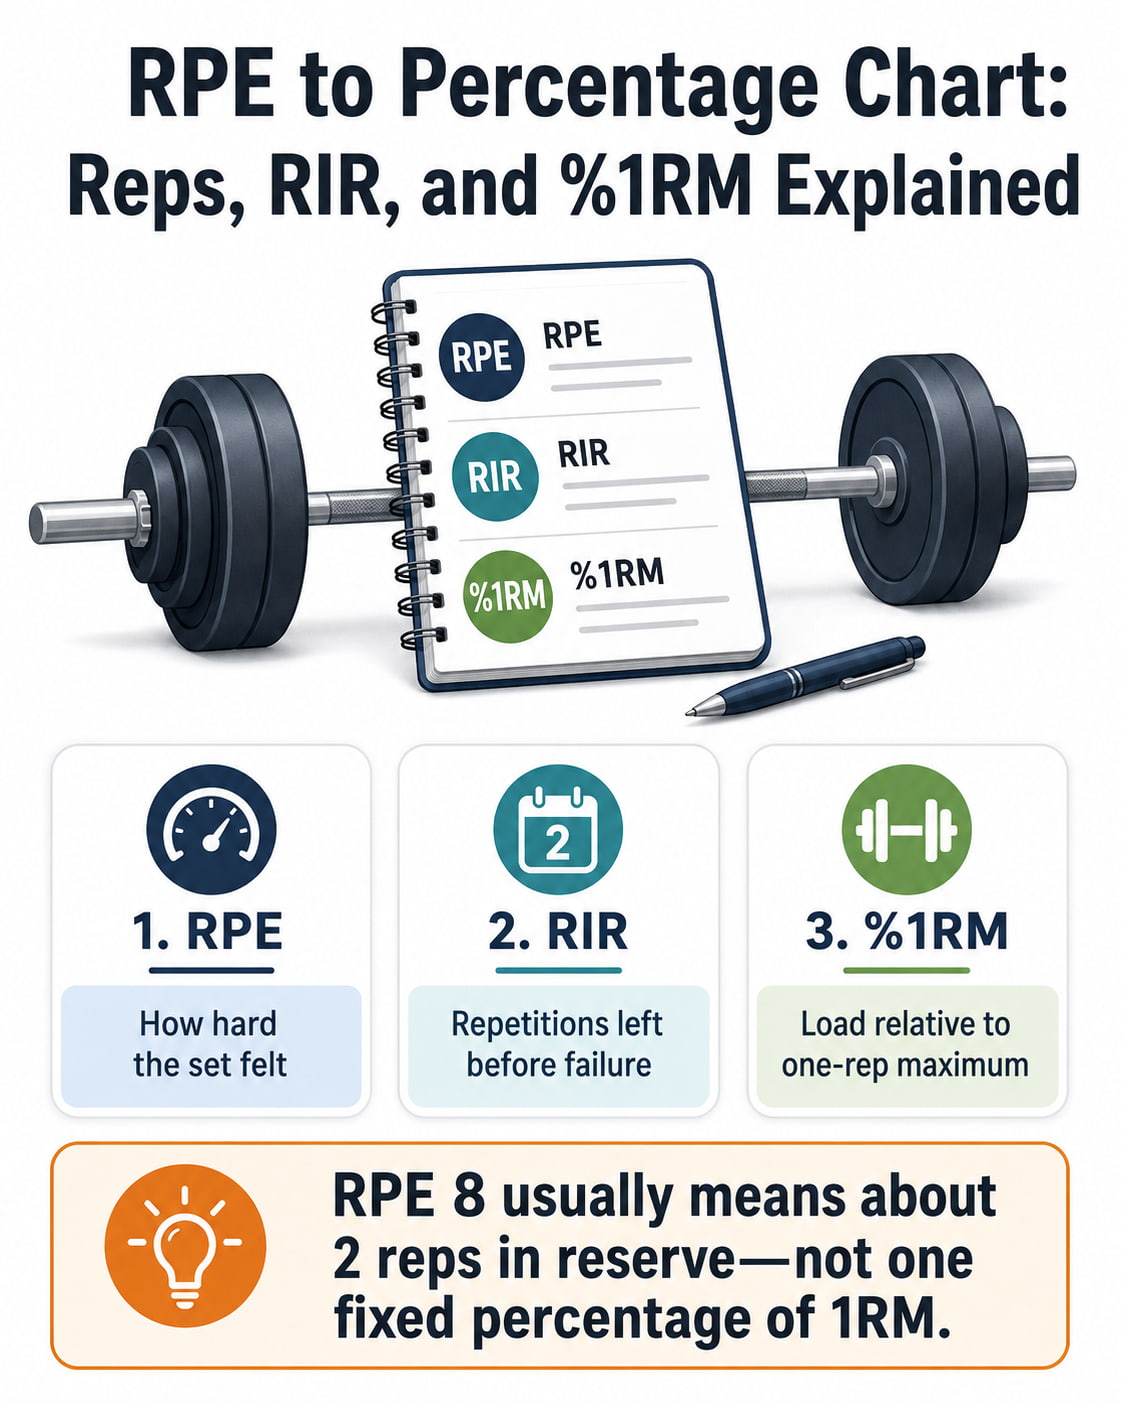
RPE 8 usually means you could complete about two more repetitions, but it does not equal one fixed percentage of your one-repetition maximum. To use an RPE to percentage chart correctly, combine the number of completed reps with your estimated reps in reserve, then match that total to an approximate percentage of 1RM.
For example, five reps at RPE 8 suggest a seven-repetition maximum and may represent about 85% of 1RM. However, one rep at RPE 8 is much heavier—approximately 95% of 1RM.
These percentages are starting estimates, not universal rules. Exercise choice, muscular endurance, technique, fatigue, and experience can all change how many repetitions you can perform with a given percentage.
RPE to Percentage Chart at a Glance
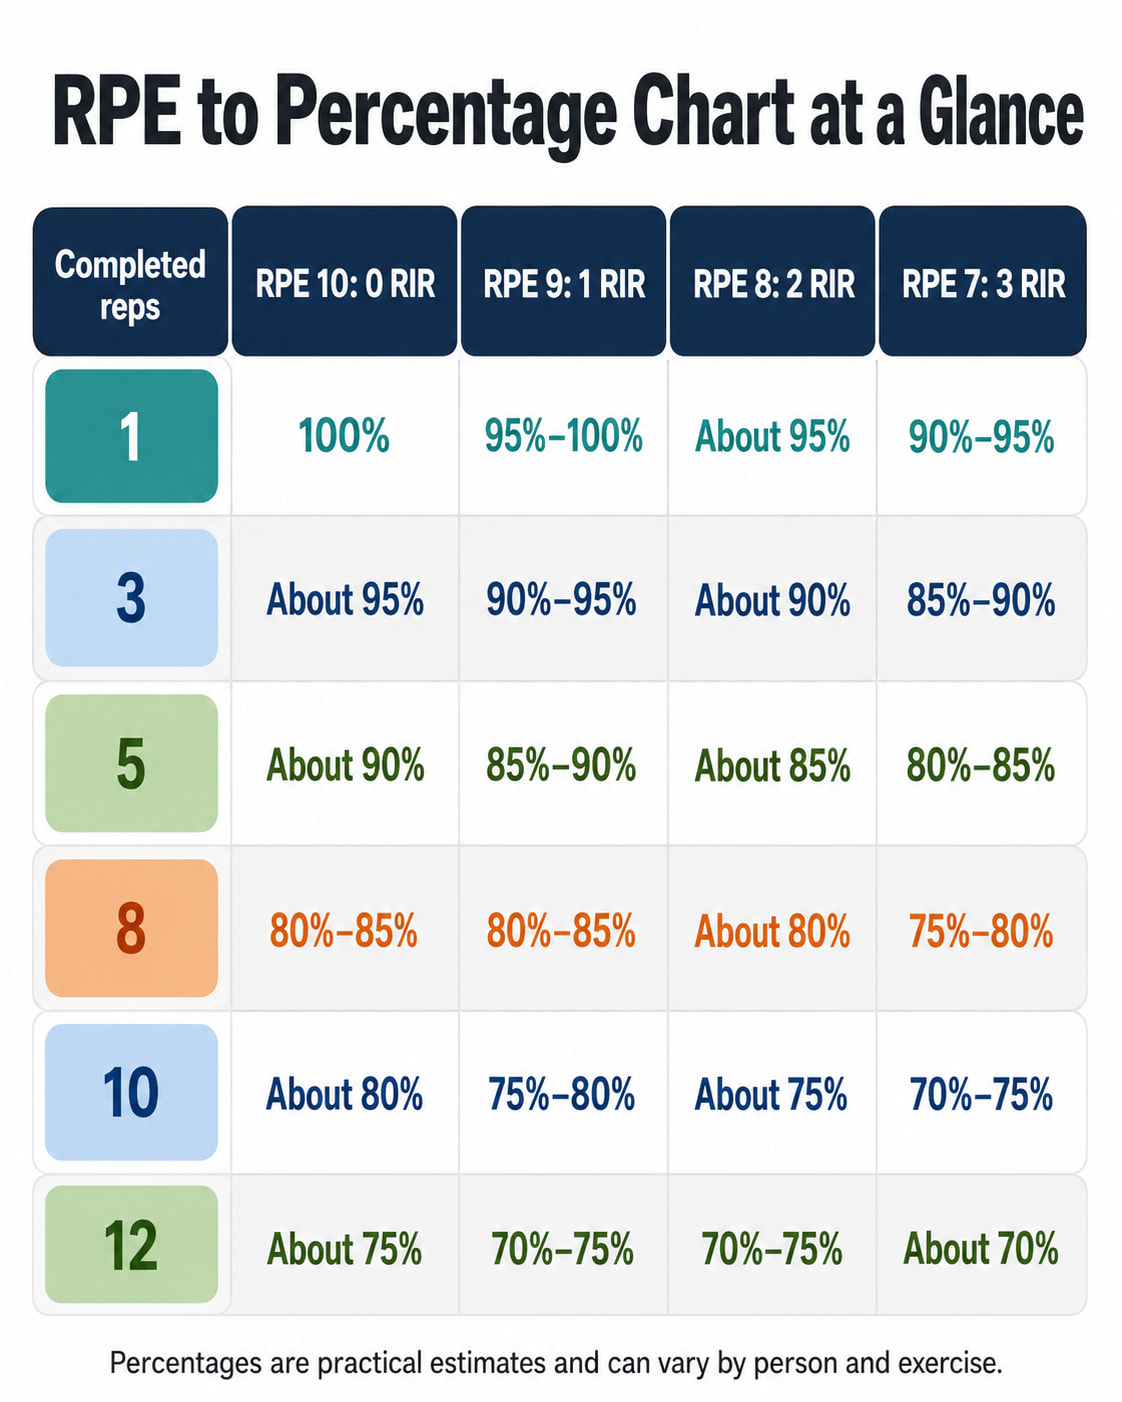
The following chart combines completed reps with the approximate RIR for each RPE. The percentages are rounded ranges based on the average repetitions-to-failure relationship reported in a large 2024 meta-regression published in Sports Medicine.
| Completed reps | RPE 10: 0 RIR | RPE 9: 1 RIR | RPE 8: 2 RIR | RPE 7: 3 RIR |
|---|---|---|---|---|
| 1 | 100% | 95%–100% | About 95% | 90%–95% |
| 3 | About 95% | 90%–95% | About 90% | 85%–90% |
| 5 | About 90% | 85%–90% | About 85% | 80%–85% |
| 8 | 80%–85% | 80%–85% | About 80% | 75%–80% |
| 10 | About 80% | 75%–80% | About 75% | 70%–75% |
| 12 | About 75% | 70%–75% | 70%–75% | About 70% |
This table is a practical estimate created by adding completed reps to RIR and matching the result to the study’s average rep-max data. It is not a validated conversion for every person or exercise.
The underlying research found substantial individual variation, particularly at lighter percentages of 1RM.
What Do RPE, RIR, and %1RM Mean?
These three measurements describe training intensity from different perspectives.
What Is RPE?
RPE means rating of perceived exertion. In strength training, it commonly uses a scale from 1 to 10 to describe how difficult a set was based on how many additional repetitions you believe you could have completed.
The resistance-training-specific scale developed by Zourdos and colleagues connects higher RPE ratings with fewer repetitions remaining. An RPE of 10 represents a maximal set, while RPE 8 generally means approximately two good repetitions remained.
The original study, available through the National Library of Medicine, examined the use of this scale in experienced and novice squatters.
Strength-training RPE differs from the traditional Borg 6–20 exertion scale frequently used for cardiovascular exercise.
What Is RIR?
RIR means repetitions in reserve. It estimates how many additional complete repetitions you could have performed before reaching task failure.
For example:
- Finishing with no repetitions remaining equals 0 RIR.
- Being able to complete one more repetition equals 1 RIR.
- Being able to complete two more repetitions equals 2 RIR.
Count only repetitions you could perform with the intended range of motion and acceptable technique. A poorly controlled partial repetition should not count as a full rep in reserve.
What Is %1RM?
Your one-repetition maximum, or 1RM, is the heaviest load you can lift once for a specific exercise with acceptable technique.
A percentage of 1RM expresses your training weight relative to that maximum:
- If your bench press 1RM is 200 pounds, 80% is 160 pounds.
- If your squat 1RM is 300 pounds, 85% is 255 pounds.
- If your deadlift 1RM is 400 pounds, 70% is 280 pounds.
Unlike RPE, a percentage does not automatically account for daily fatigue, sleep, stress, or changes in readiness.
RPE and RIR Conversion Chart
The basic relationship is:
RIR ≈ 10 − RPE
This relationship works most clearly from approximately RPE 7 to RPE 10.
| RPE | Approximate RIR | What the set feels like |
|---|---|---|
| 10 | 0 | No additional full repetition was possible |
| 9.5 | 0 | No additional rep, but slightly more weight may have been possible |
| 9 | 1 | One good repetition remained |
| 8.5 | 1–2 | Between one and two reps remained |
| 8 | 2 | Two good repetitions remained |
| 7.5 | 2–3 | Between two and three reps remained |
| 7 | 3 | Three good repetitions remained |
| 6 | 4 or more | Relatively light effort |
| Below 6 | Difficult to estimate precisely | Far from failure |
An RPE of 6 does not always equal exactly 4 RIR. Once a set finishes far from failure, accurately predicting the remaining repetitions becomes more difficult.
A 2024 review published through SAGE Journals found that RIR-based scales can be practical for selecting and regulating resistance-training intensity. However, estimates tend to become more useful when sets finish reasonably close to failure and the lifter has experience with the scale.
How to Convert RPE to Percentage of 1RM
Use the following three-step method.
Step 1: Convert RPE to RIR
Subtract the RPE from 10.
For whole-number ratings:
- RPE 10 = 0 RIR
- RPE 9 = 1 RIR
- RPE 8 = 2 RIR
- RPE 7 = 3 RIR
Step 2: Add Completed Reps and RIR
Use this formula:
Estimated maximum reps = completed reps + RIR
For example, suppose you complete five reps at RPE 8:
5 completed reps + 2 RIR = approximately a 7RM
This means you estimate that seven total repetitions would have brought you to failure at that weight.
Step 3: Match the Rep Maximum to %1RM
Use a repetitions-to-percentage chart to estimate what percentage corresponds to that rep maximum.
The updated research average places approximately seven repetitions at 85% of 1RM. Therefore:
5 reps at RPE 8 ≈ 85% of 1RM
More Conversion Examples
| Training set | Calculation | Estimated rep maximum | Approximate %1RM |
|---|---|---|---|
| 1 rep at RPE 8 | 1 + 2 RIR | 3RM | About 95% |
| 3 reps at RPE 9 | 3 + 1 RIR | 4RM | 90%–95% |
| 5 reps at RPE 8 | 5 + 2 RIR | 7RM | About 85% |
| 6 reps at RPE 9 | 6 + 1 RIR | 7RM | About 85% |
| 8 reps at RPE 8 | 8 + 2 RIR | 10RM | About 80% |
| 10 reps at RPE 8 | 10 + 2 RIR | 12RM | About 75% |
| 12 reps at RPE 7 | 12 + 3 RIR | 15RM | About 70% |
These examples show why “RPE 8 equals 80%” is incorrect. The number of completed repetitions must also be considered.
Updated Reps-to-%1RM Chart
The 2024 meta-regression analyzed 952 repetitions-to-failure tests involving 7,289 people from 269 studies. The researchers estimated the average maximum repetitions people could perform at percentages ranging from 15% to 95% of 1RM.
| Percentage of 1RM | Approximate maximum reps |
|---|---|
| 100% | 1 by definition |
| 95% | About 3 |
| 90% | About 5 |
| 85% | About 7 |
| 80% | About 10 |
| 75% | About 12 |
| 70% | About 15 |
| 65% | About 17 |
| 60% | About 20 |
These are estimated repetitions to task failure, which approximately represents RPE 10. They are not recommendations to perform every set to failure.
The estimates also become less precise at lighter weights. People differ more in the number of repetitions they can complete at 60% or 70% than at heavier percentages such as 90% or 95%.
Why Do RPE Percentage Charts Give Different Numbers?
You may find one chart stating that five reps at RPE 8 equals 81%, while another estimates approximately 85%. Several factors explain this difference.
Traditional Charts Use Older Coaching Estimates
A commonly cited 2016 conversion table estimated:
| Set | Traditional estimate |
|---|---|
| 1 rep at RPE 8 | 91% |
| 3 reps at RPE 8 | 85% |
| 5 reps at RPE 8 | 81% |
| 8 reps at RPE 8 | 73% |
The table, documented in research available through PubMed Central, was developed from mean RPE results reported by experienced squatters in a relatively small study.
It became a practical coaching tool, but it was not designed as a universal physiological rule.
The larger 2024 meta-regression generally estimated that people could complete more repetitions at some percentages than older tables suggested. For example, the older model associated 70% of 1RM with about 11 repetitions, while the newer general model estimated approximately 15.
The Exercise Changes the Result
The number of repetitions possible at one percentage is not identical across exercises.
In the newer analysis, people averaged approximately:
- Nine bench-press repetitions at 80% of 1RM
- Thirteen leg-press repetitions at 80% of 1RM
- Four bench-press repetitions at 90%
- Nine leg-press repetitions at 90%
The researchers created separate estimates for the bench press and leg press because these exercises showed meaningful differences. Data were insufficient to create individual tables for many other movements.
Individual Muscular Endurance Varies
Two people with the same 1RM may complete different numbers of repetitions with 75% of that maximum.
The relationship can be affected by:
- Exercise selection
- Muscle groups involved
- Range of motion
- Repetition speed
- Training experience
- Technique
- Rest periods
- Previous sets
- Current fatigue and recovery
- Individual muscular endurance
For this reason, your recent training record may eventually predict your working weights better than a general chart.
How to Use RPE to Choose Your Training Weight
An RPE to percentage chart works best as a starting point, followed by an adjustment based on how the weight actually moves and feels.
Suppose your squat 1RM is 300 pounds and the workout calls for five reps at RPE 8.
The updated estimate suggests approximately 85%:
300 × 0.85 = 255 pounds
You might use 255 pounds as an initial estimate. After warm-up sets:
- Use the weight if five reps would leave approximately two good reps.
- Reduce it if five reps would be RPE 9 or 10.
- Increase it slightly if five reps would be RPE 6 or 7.
The objective is not to force the chart’s percentage. The objective is to reach the prescribed reps and effort with controlled technique.
Use Recent Performance When Available
Your own training history is usually more useful than a generic percentage.
For example, if your records repeatedly show that 245 pounds produces five squat reps at RPE 8, start near 245—even if a chart suggests 255.
Track:
- Exercise
- Weight
- Repetitions
- RPE or RIR
- Technique notes
- Estimated 1RM
- Unusual fatigue or soreness
Over time, patterns will show which percentages fit each exercise.
How RPE and Percentage-Based Training Work Together
You do not need to choose only one method.
A practical approach is to use:
- %1RM to select an initial weight
- RPE to check whether that weight matches the intended effort
- Your training log to improve future estimates
Percentage-based training provides structure. RPE allows you to adjust that structure when your performance is better or worse than expected.
This can be especially helpful when a previously tested 1RM is outdated. If your strength has increased, an old percentage may feel too easy. If you are fatigued, the same percentage may feel much harder.
Using RPE for Different Training Goals
RPE does not determine the goal by itself. Repetitions, load, volume, movement speed, exercise selection, and recovery all matter.
Maximum Strength
Strength-focused work frequently uses heavier loads and lower repetitions. The 2026 resistance-training guidance from the American College of Sports Medicine highlights loads around 80% of 1RM or higher for improving maximum strength.
Most working sets do not have to reach RPE 10. Heavy sets performed at RPE 7–9 can provide demanding strength practice while leaving some capacity in reserve.
Muscle Growth
Hypertrophy training can use a broad range of loads. RPE helps confirm that a set is sufficiently challenging without requiring every set to reach complete failure.
Many lifters keep most working sets within approximately one to three repetitions of failure. The appropriate target depends on the exercise, program, training volume, and ability to recover.
Power
Power training emphasizes moving the load quickly rather than grinding to failure. Current ACSM guidance describes moderate loads of approximately 30%–70% of 1RM for power training, performed with an intention to move rapidly during the lifting phase.
RIR-based ratings become less precise when a set stops far from failure, so repetition speed and technique may be more useful than trying to assign an exact RPE.
Technique and Recovery Work
Technique sessions and easier recovery work may stay around RPE 5–7. At these effort levels, use RPE as a broad description rather than assuming an exact number of repetitions remained.
Common RPE Mistakes
Treating Discomfort as Proximity to Failure
A set can feel uncomfortable because of breathing, muscle burning, or cardiovascular demand while still leaving several repetitions in reserve.
Rate the number of additional technically acceptable repetitions—not discomfort alone.
Calling Every Hard Set RPE 10
RPE 10 means another complete repetition was not possible. A difficult set that still had one repetition remaining was closer to RPE 9.
Ignoring Technique
Do not count repetitions that would require a substantially shortened range of motion, unsafe position, or loss of control.
Using the Same Percentage for Every Exercise
Your squat, bench press, leg press, dumbbell curl, and machine row may have different repetitions-to-percentage relationships.
Rating the Set Before It Is Finished
RPE describes the completed set. Select a target beforehand, but assign the final rating after the last repetition.
Expecting Immediate Accuracy
Estimating RIR is a skill. Record your ratings consistently and compare them with later performance.
Accuracy generally improves with practice and with sets performed closer to failure.
RPE Safety Considerations
You do not need to reach failure to determine whether a workout is productive. The ACSM evidence review found that training to momentary muscular failure did not consistently improve outcomes for the average healthy adult.
Use safety arms, catches, or a qualified spotter for heavy barbell exercises. Stop the set when technique becomes unsafe or when you experience sharp pain, dizziness, chest discomfort, or unusual shortness of breath.
People returning after an injury, managing a medical condition, or new to heavy resistance training may benefit from guidance from an appropriate healthcare or fitness professional.
Frequently Asked Questions
Is RPE 8 the Same as 80% of 1RM?
No. RPE 8 means approximately two repetitions remained. The percentage depends on how many reps you completed.
One rep at RPE 8 may be around 95%, five reps may be around 85%, and eight reps may be around 80%.
What Percentage of 1RM Is Five Reps at RPE 8?
Using the updated average relationship, five reps plus two RIR equals an estimated 7RM, which corresponds to approximately 85% of 1RM.
Older conversion charts may place five reps at RPE 8 closer to 80%–81%, illustrating why the result should be treated as a starting range.
Is RPE 10 Always 100% of 1RM?
No. Only one rep at RPE 10 represents a true 1RM.
Five reps at RPE 10 represent a 5RM, estimated at approximately 90% in the updated research model. Ten reps at RPE 10 average approximately 80%.
How Do I Convert RIR to RPE?
For whole-number ratings, subtract RIR from 10:
RPE = 10 − RIR
Therefore, 0 RIR equals RPE 10, 1 RIR equals RPE 9, and 2 RIR equals RPE 8.
Is RPE More Accurate Than Percentage-Based Training?
Neither method is always more accurate. Percentages provide an objective starting point, while RPE adjusts for current readiness and individual differences.
Combining the two methods usually provides more context than relying on either one alone.
How Accurate Is an RPE to Percentage Chart?
It provides a reasonable starting estimate, especially for experienced lifters performing lower-repetition sets close to failure.
Accuracy generally decreases with high-repetition sets, lighter loads, unfamiliar exercises, and sets stopped far from failure.
Can Beginners Use RPE?
Beginners can use RPE, but exact RIR estimates may be difficult initially. Broad descriptions such as easy, moderate, challenging, and near-maximal may be more useful until the lifter develops consistent technique and better awareness of proximity to failure.
Conclusion
An RPE to percentage chart helps connect subjective effort with objective training load, but the number of completed repetitions must always be included.
Remember the basic process:
Convert RPE to RIR, add RIR to completed reps, and match the estimated rep maximum to a %1RM range.
Use the result to choose an initial load, then adjust according to technique, bar speed, and your actual effort. Recording your sets over time will help you build a personalized chart that is more useful than any general table.
This content is for informational purposes only and not medical advice.
References
- American College of Sports Medicine, 2026 Resistance Training Guidelines Update
- Nuzzo et al., Maximal Number of Repetitions at Percentages of the One-Repetition Maximum, Sports Medicine, 2024
- Zourdos et al., Novel Resistance Training-Specific Rating of Perceived Exertion Scale Measuring Repetitions in Reserve, 2016
- Bastos et al., Feasibility and Usefulness of Repetitions-in-Reserve Scales for Selecting and Regulating Resistance Training Intensity, 2024
- Helms et al., Application of the Repetitions-in-Reserve-Based Rating of Perceived Exertion Scale for Resistance Training, 2016