
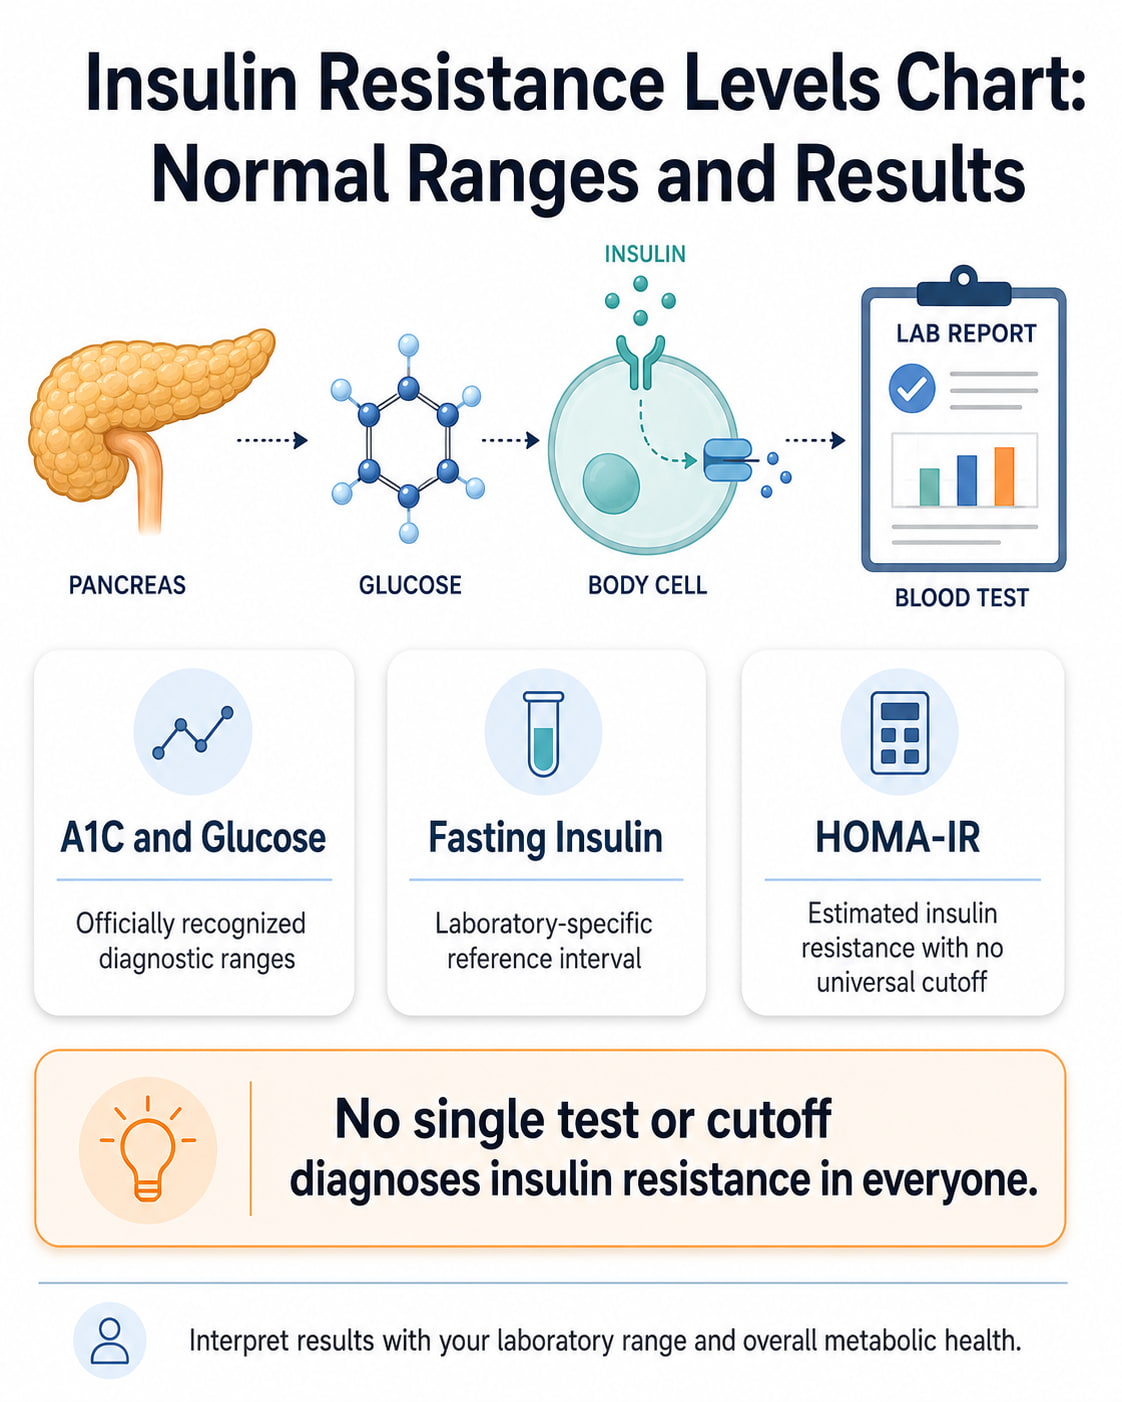
There is no single, universally accepted blood test or cutoff that classifies insulin resistance as normal, mild, moderate, or severe. Doctors usually evaluate A1C, fasting glucose, oral glucose tolerance results, health history, and metabolic risk factors instead of relying on one insulin-resistance number.
Fasting insulin and HOMA-IR may provide additional information, but their reference ranges vary by laboratory, testing method, and population. The National Institute of Diabetes and Digestive and Kidney Diseases notes that direct insulin-resistance testing is used mainly in research rather than routine clinical care.
Insulin Resistance Levels Chart
The most useful way to read an insulin resistance levels chart is to separate validated glucose thresholds from supplemental insulin measurements.
Glucose-Based Diagnostic Ranges
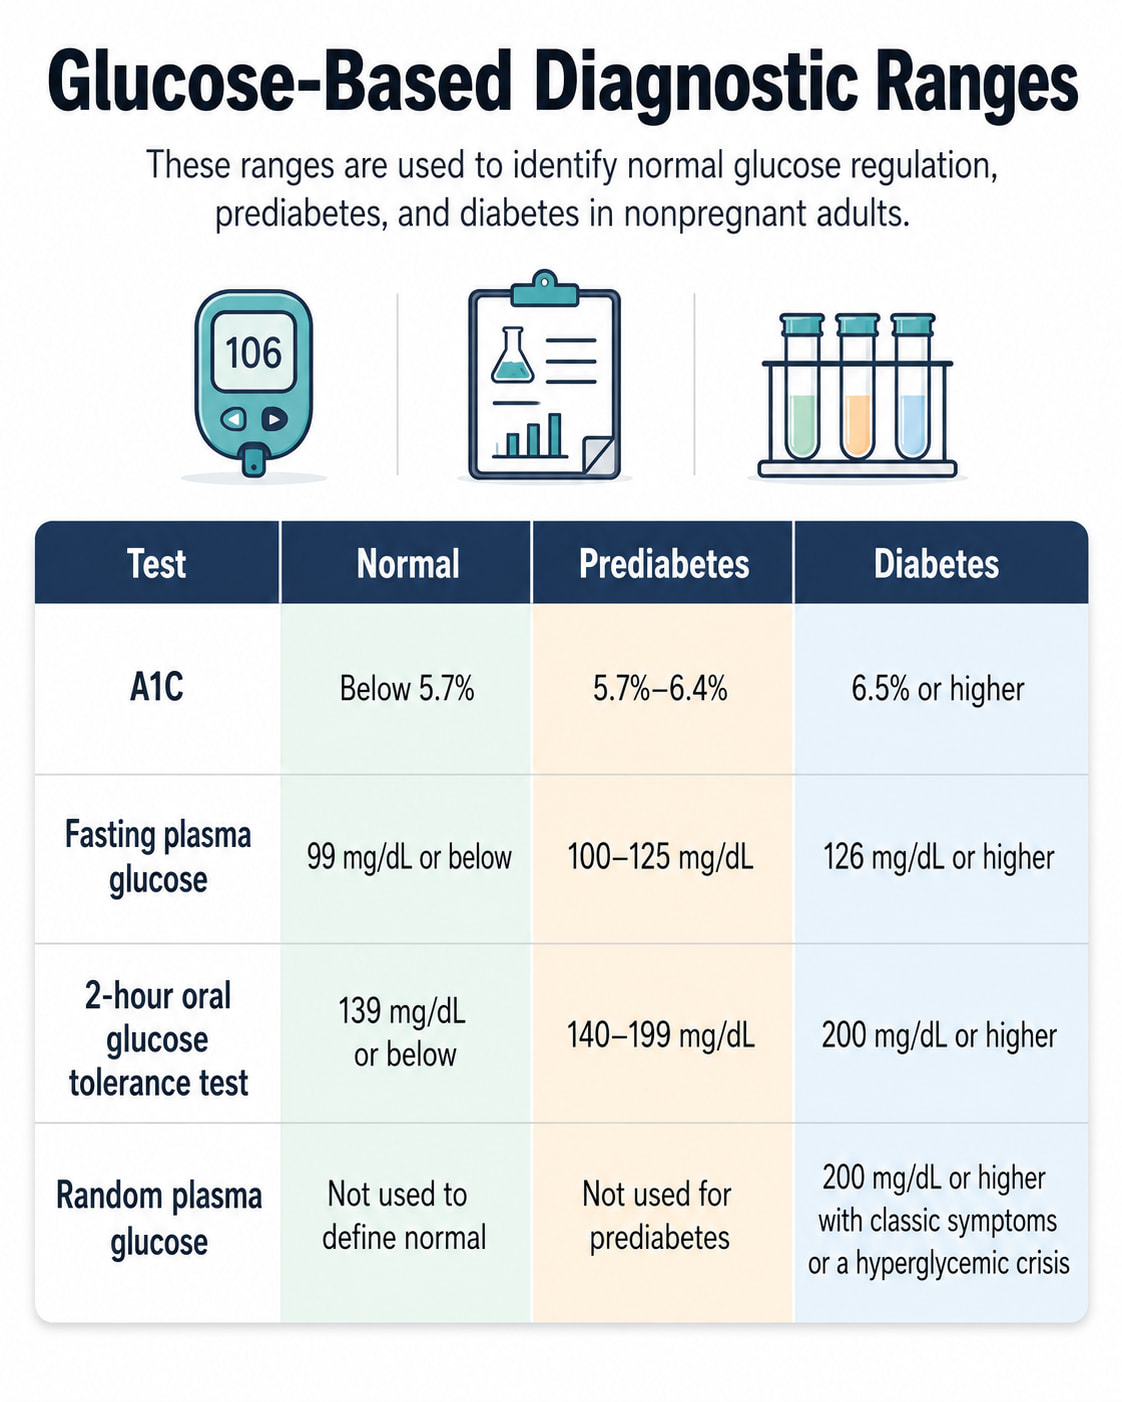
These ranges are used to identify normal glucose regulation, prediabetes, and diabetes in nonpregnant adults.
| Test | Normal | Prediabetes | Diabetes |
|---|---|---|---|
| A1C | Below 5.7% | 5.7%–6.4% | 6.5% or higher |
| Fasting plasma glucose | 99 mg/dL or below | 100–125 mg/dL | 126 mg/dL or higher |
| 2-hour oral glucose tolerance test | 139 mg/dL or below | 140–199 mg/dL | 200 mg/dL or higher |
| Random plasma glucose | Not used to define normal | Not used for prediabetes | 200 mg/dL or higher with classic symptoms or a hyperglycemic crisis |
The 2026 American Diabetes Association Standards of Care continue to recommend A1C, fasting plasma glucose, the 2-hour oral glucose tolerance test, and symptom-associated random plasma glucose for diagnosing diabetes. Unless hyperglycemia is unmistakable, an abnormal diabetes-range result generally requires confirmation.
These tests identify abnormal blood sugar. They do not directly measure how sensitive your cells are to insulin.
Supplemental Insulin Resistance Markers
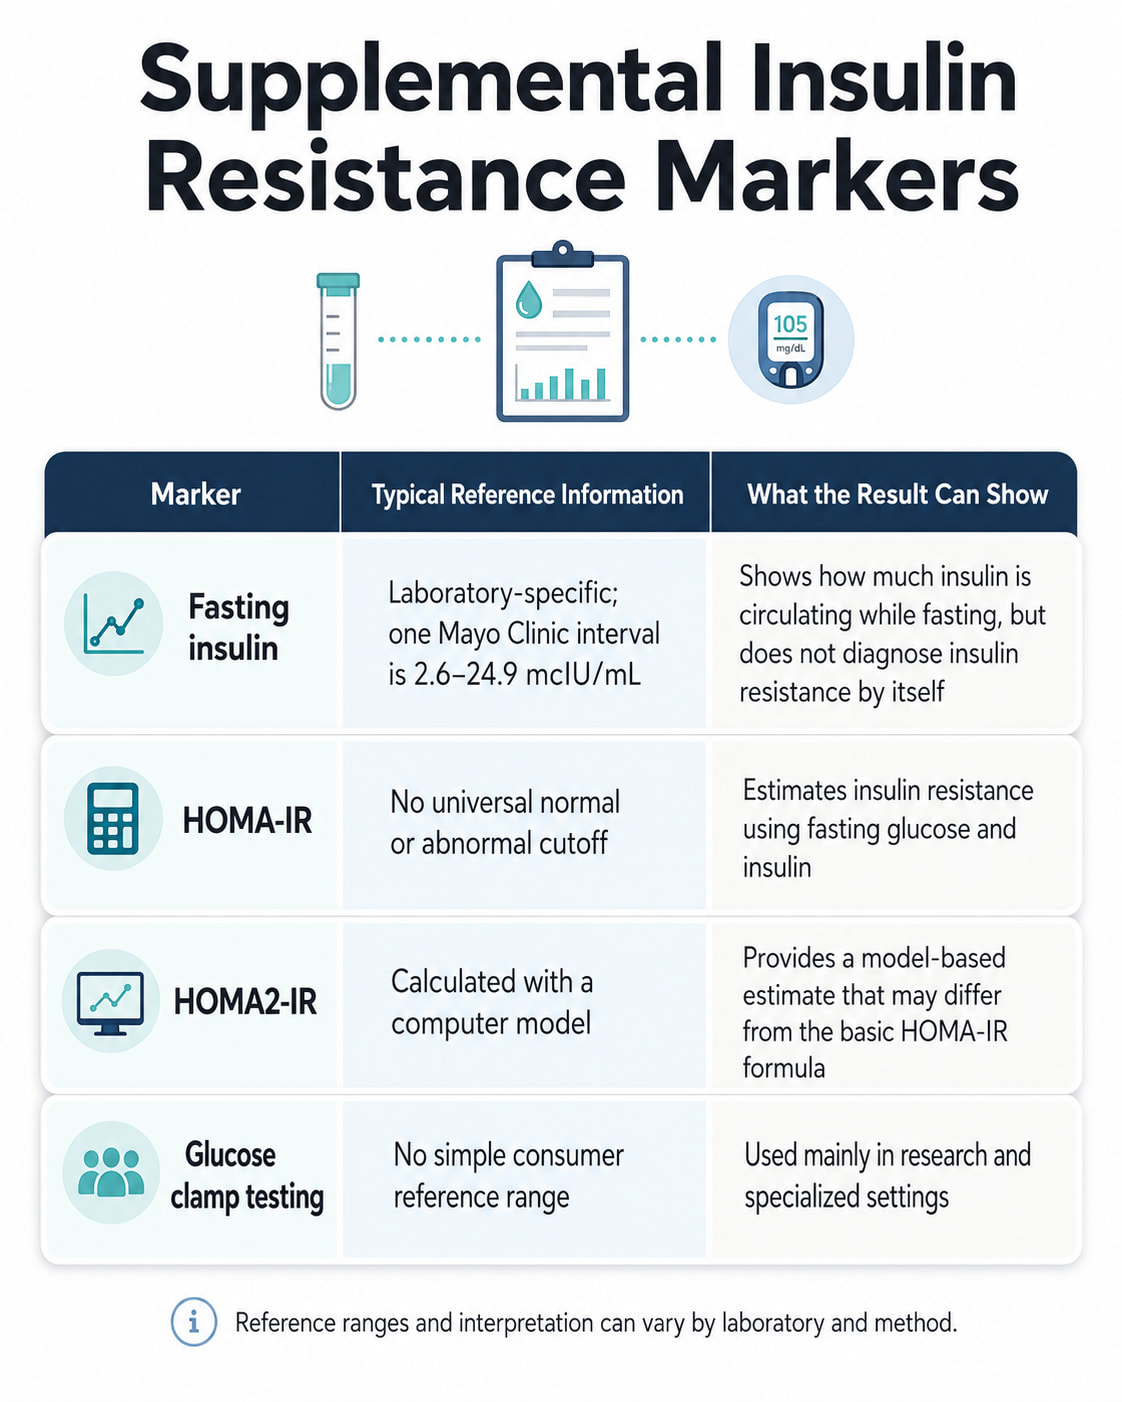
| Marker | Typical Reference Information | What the Result Can Show |
|---|---|---|
| Fasting insulin | Laboratory-specific; one Mayo Clinic interval is 2.6–24.9 mcIU/mL | Shows how much insulin is circulating while fasting, but does not diagnose insulin resistance by itself |
| HOMA-IR | No universal normal or abnormal cutoff | Estimates insulin resistance using fasting glucose and insulin |
| HOMA2-IR | Calculated with a computer model | Provides a model-based estimate that may differ from the basic HOMA-IR formula |
| Glucose clamp testing | No simple consumer reference range | Used mainly in research and specialized settings |
A number printed within a laboratory’s reference interval does not guarantee ideal insulin sensitivity. Likewise, a result outside the interval does not establish insulin resistance without other clinical information.
Is There a Normal Insulin Resistance Level?
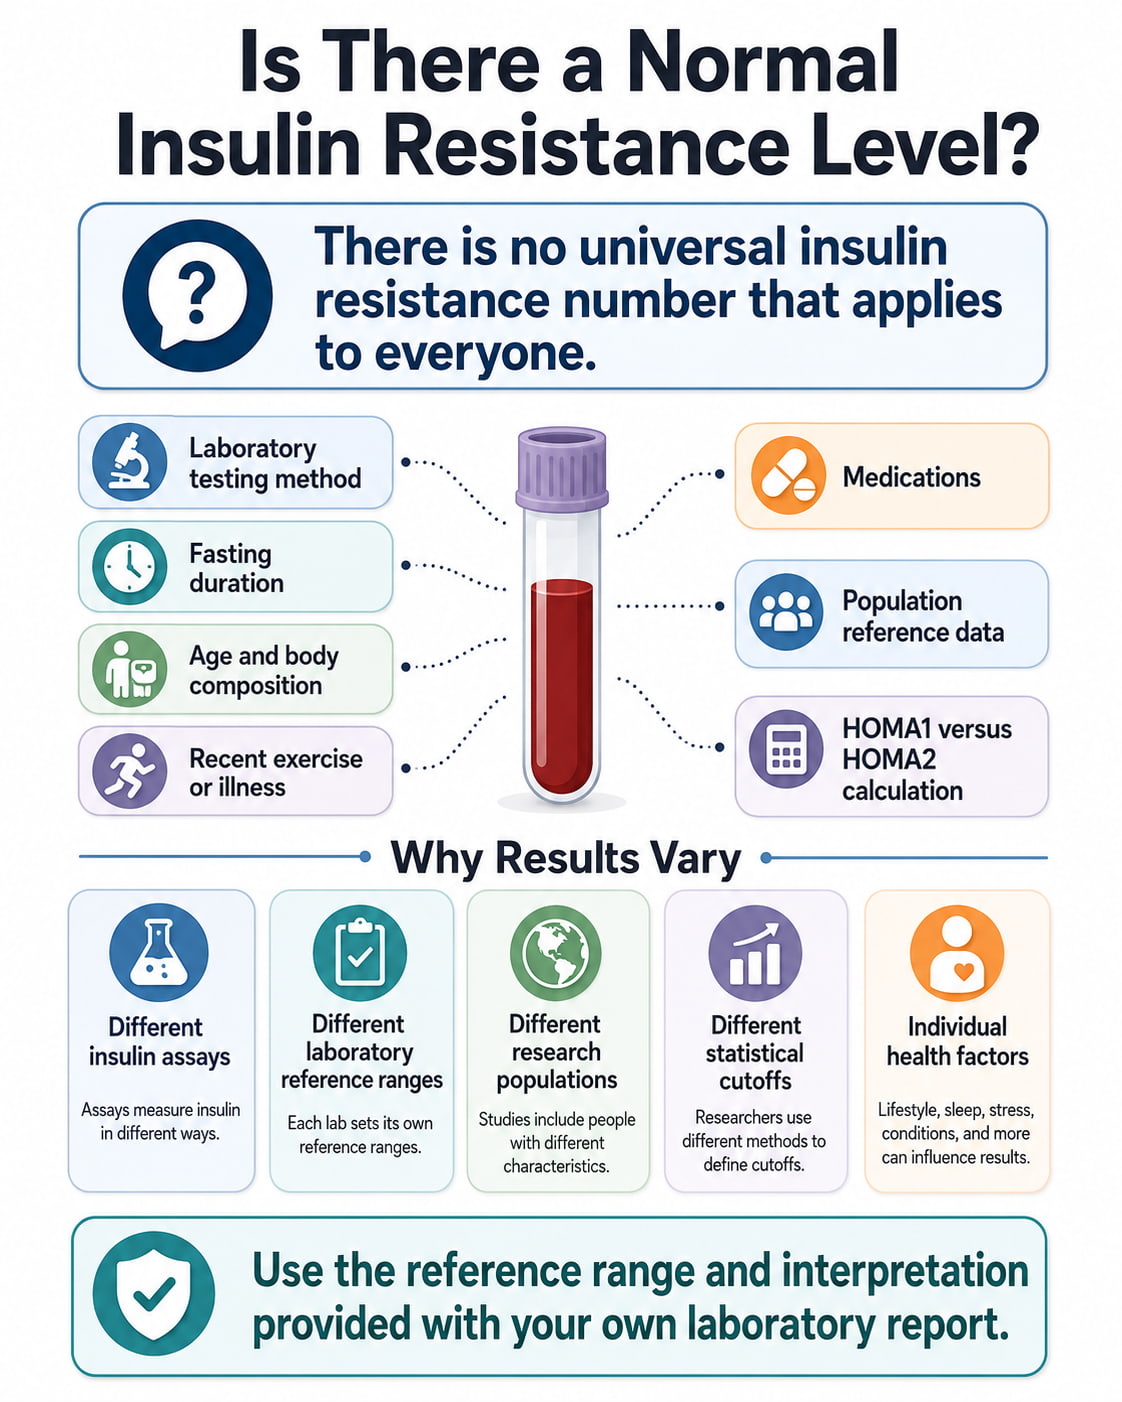
There is no official “normal insulin resistance level” that applies to everyone.
Insulin sensitivity exists on a spectrum and may be assessed in several ways. Results can vary with:
- The insulin assay used by the laboratory
- Whether the sample was serum or plasma
- Fasting duration
- Recent exercise, illness, stress, or sleep
- Medications
- Age and body composition
- The population used to create the reference interval
- Whether the calculation uses HOMA1 or HOMA2
The University of Oxford Diabetes Trials Unit specifically states that HOMA values depend on the glucose, insulin, and C-peptide assays used. For that reason, it does not define absolute thresholds separating normal and abnormal HOMA results.
Be cautious with online charts that divide HOMA-IR into categories such as “optimal,” “early resistance,” and “severe resistance.” These categories are not universally accepted diagnostic standards.
What Is Insulin Resistance?
Insulin is a hormone produced by the pancreas. It helps glucose move from the bloodstream into muscle, fat, and other cells, where it can be used or stored.
Insulin resistance develops when these cells do not respond to insulin as effectively as expected. The pancreas may compensate by producing more insulin.
During this early compensatory stage:
- Fasting insulin may increase.
- HOMA-IR may increase.
- Fasting glucose may remain normal.
- A1C may remain below the prediabetes range.
Over time, the pancreas may no longer produce enough insulin to keep blood glucose within the normal range. Blood sugar can then rise into the prediabetes or diabetes range.
Understanding A1C Results
A1C estimates your average blood glucose over approximately the previous three months.
| A1C Result | General Meaning |
|---|---|
| Below 5.7% | Normal glucose range |
| 5.7%–6.4% | Prediabetes |
| 6.5% or higher | Diabetes range |
A normal A1C does not completely exclude early insulin resistance. The pancreas may still be producing enough extra insulin to keep average glucose controlled.
A1C may also be less reliable in some situations, including certain anemias, hemoglobin variants, and later pregnancy. When A1C does not match measured glucose results, a health care professional may use fasting glucose or an oral glucose tolerance test instead.
Understanding Fasting Glucose Results
Fasting plasma glucose measures your blood sugar after at least eight hours without food or caloric drinks.
| Fasting Glucose | General Meaning |
|---|---|
| 99 mg/dL or below | Normal |
| 100–125 mg/dL | Prediabetes |
| 126 mg/dL or higher | Diabetes range |
Fasting glucose is convenient, but it captures only one point in time. Illness, stress, medications, poor sleep, and changes in food intake or activity may affect the result.
Some people have normal fasting glucose but abnormal A1C or oral glucose tolerance results. A clinician may recommend another test when risk remains high despite an initial normal result.
Understanding Oral Glucose Tolerance Test Results
An oral glucose tolerance test, or OGTT, measures how your body handles a measured glucose drink.
For the standard 2-hour test:
| 2-Hour Glucose | General Meaning |
|---|---|
| 139 mg/dL or below | Normal |
| 140–199 mg/dL | Prediabetes |
| 200 mg/dL or higher | Diabetes range |
The OGTT can identify impaired glucose handling that does not appear on a fasting glucose test. However, it takes longer and requires specific preparation.
Pregnancy uses different testing procedures and thresholds. The ranges above should not be used to interpret gestational diabetes testing.
Fasting Insulin Levels
Fasting insulin measures the amount of insulin circulating after a fasting period, usually at least eight hours.
Reference intervals vary considerably. For example, Mayo Clinic Laboratories lists a fasting insulin reference interval of 2.6–24.9 mcIU/mL for its specific test. That range should not be treated as a universal insulin-resistance cutoff.
What a High Fasting Insulin Result May Mean
A higher fasting insulin result may occur when the pancreas is releasing additional insulin to keep glucose controlled. This pattern can be consistent with reduced insulin sensitivity, especially when accompanied by:
- Elevated fasting glucose
- Prediabetes-range A1C
- High triglycerides
- Low HDL cholesterol
- A large waist circumference
- High blood pressure
- Metabolic dysfunction-associated steatotic liver disease
- Polycystic ovary syndrome
However, fasting insulin can also be affected by the test method, fasting conditions, medications, acute illness, and uncommon pancreatic conditions. One result cannot identify the cause.
Does Low Fasting Insulin Mean Good Insulin Sensitivity?
Not necessarily.
A lower insulin level may be expected when blood glucose is also low or normal. However, insulin production can decline when pancreatic beta cells are unable to produce enough insulin. Mayo Clinic Laboratories notes that insulin may be normal or elevated earlier in type 2 diabetes and may decrease during later stages.
Fasting insulin should therefore be interpreted alongside glucose rather than on its own.
HOMA-IR Levels and Formula
HOMA-IR stands for Homeostatic Model Assessment of Insulin Resistance. It is a calculated estimate based on fasting insulin and fasting glucose collected at approximately the same time.
HOMA-IR Formula Using mg/dL
HOMA-IR = fasting insulin × fasting glucose ÷ 405
Use:
- Fasting insulin in µIU/mL
- Fasting glucose in mg/dL
HOMA-IR Formula Using mmol/L
HOMA-IR = fasting insulin × fasting glucose ÷ 22.5
Use:
- Fasting insulin in µIU/mL
- Fasting glucose in mmol/L
The University of Oxford explains that these equations are linear approximations from the original HOMA1 model. HOMA2 uses a more complex computer model and may produce different results, especially when glucose or insulin values are unusually high or low.
HOMA-IR Calculation Example
Suppose your laboratory results show:
- Fasting glucose: 100 mg/dL
- Fasting insulin: 10 µIU/mL
The calculation would be:
100 × 10 ÷ 405 = 2.47
The calculated HOMA-IR is 2.47.
This number cannot be labeled normal or abnormal without knowing the laboratory method, comparison population, and reason for testing. It should not be used to diagnose yourself or make medication changes.
What HOMA-IR Result Indicates Insulin Resistance?
No HOMA-IR number identifies insulin resistance in every population.
Research studies often establish their own cutoffs. One study may use a cutoff near 2, while another may use a value closer to 3 or 4. These differences arise because studies use different:
- Insulin assays
- Age groups
- Ethnic or geographic populations
- Body-weight distributions
- Definitions of metabolic risk
- Statistical methods
In general, a higher HOMA-IR suggests lower insulin sensitivity when results are compared within the same testing method and population. It is more useful for comparing groups in research or tracking results under consistent conditions than for making a stand-alone diagnosis.
How to Interpret Insulin and Glucose Results Together
| Result Pattern | Possible Interpretation |
|---|---|
| Normal glucose and normal A1C | Current results do not meet prediabetes or diabetes criteria |
| Normal glucose with higher fasting insulin or HOMA-IR | May reflect compensatory insulin production, but testing limitations must be considered |
| Prediabetes-range A1C or glucose | Blood sugar regulation is impaired; insulin resistance is common but not directly measured |
| Diabetes-range result | Requires clinical assessment and usually confirmation unless hyperglycemia is unequivocal |
| Normal fasting glucose with high 2-hour OGTT | Glucose may be normal while fasting but rise excessively after a glucose load |
| High glucose with low or normal insulin | May indicate inadequate insulin production, but additional testing is needed |
| A1C and glucose do not agree | Testing conditions or factors affecting A1C should be reviewed |
A clinician may also review blood pressure, waist circumference, triglycerides, HDL cholesterol, liver tests, medications, and family history to understand the overall metabolic picture.
Can You Have Insulin Resistance With Normal Blood Sugar?
Yes. Blood glucose may remain within the normal range during early insulin resistance.
The pancreas can initially compensate by releasing more insulin. This may keep fasting glucose and A1C normal even though the body requires more insulin than before.
This is one reason a normal glucose result does not provide a complete picture for everyone. At the same time, a fasting insulin or HOMA-IR result should not be considered proof of insulin resistance without supporting clinical evidence.
Signs and Symptoms of Insulin Resistance
Insulin resistance and prediabetes usually cause no noticeable symptoms. Many people discover abnormal glucose levels through routine blood testing.
When blood glucose becomes substantially elevated, possible symptoms include:
- Increased thirst
- Frequent urination
- Unexplained weight loss
- Blurred vision
- Fatigue
- Slow-healing sores
- Recurrent infections
Symptoms should be evaluated rather than attributed to insulin resistance without testing.
Risk Factors Associated With Insulin Resistance
Your chance of developing insulin resistance or prediabetes may be higher if you have:
- Overweight, obesity, or a large waist circumference
- A family history of type 2 diabetes
- Low physical activity
- A history of gestational diabetes
- Polycystic ovary syndrome
- Sleep apnea
- High triglycerides or low HDL cholesterol
- High blood pressure
- Metabolic dysfunction-associated steatotic liver disease
- Long-term use of glucocorticoids or certain antipsychotic medicines
- Increasing age
Having one or more risk factors does not mean you have insulin resistance. It may indicate that screening and preventive habits are especially important.
Who Should Be Tested?
Routine diabetes screening generally begins at age 35. Testing may start earlier for people with overweight or obesity and additional risk factors.
Children and teenagers with overweight or obesity may also need screening beginning around age 10 or after puberty when additional risk factors are present.
People with normal results are often retested at least every three years. Those diagnosed with prediabetes are generally tested for type 2 diabetes each year, although individual timing can vary.
Steps That May Improve Insulin Sensitivity
Insulin sensitivity may improve through sustainable changes that support blood glucose, cardiovascular health, sleep, and body composition.
Be Physically Active Regularly
Muscle activity increases glucose use and can support insulin sensitivity.
A practical target is at least 150 minutes of moderate-intensity activity per week, such as brisk walking. Begin at a level that fits your health and ability, especially if you have been inactive or have heart, joint, or balance concerns.
Aim for Sustainable Weight Management
For people with overweight or obesity and prediabetes, losing approximately 5%–7% of starting body weight may meaningfully lower the risk of progressing to type 2 diabetes.
The Centers for Disease Control and Prevention uses both the 5%–7% weight-loss goal and at least 150 minutes of weekly activity in its diabetes-prevention guidance. Weight loss is not necessary or appropriate for everyone.
Build Balanced Meals
Focus most meals on foods that provide fiber, protein, and minimally processed carbohydrates, such as:
- Nonstarchy vegetables
- Whole fruits
- Beans and lentils
- Whole grains
- Fish, poultry, eggs, tofu, or other protein sources
- Nuts and seeds
- Olive oil and other unsaturated fats
Limit frequent intake of sugar-sweetened beverages, heavily refined grains, and highly processed snacks. The best eating plan is one you can maintain and adapt to your medical needs, culture, preferences, and budget.
Prioritize Sleep
Insufficient or irregular sleep may make blood glucose management more difficult. Aim for a consistent sleep schedule and speak with a health care professional if you have loud snoring, breathing pauses, severe daytime sleepiness, or possible sleep apnea.
Review Medicines With Your Clinician
Some medicines can affect glucose or insulin levels. Do not stop a prescribed medicine on your own. Ask whether your medications could influence your results and whether follow-up testing is appropriate.
When to Speak With a Health Care Professional
Arrange a medical review if:
- Your A1C is 5.7% or higher.
- Your fasting glucose is 100 mg/dL or higher.
- Your 2-hour OGTT is 140 mg/dL or higher.
- Your fasting insulin is outside your laboratory’s reference interval.
- You received a HOMA-IR result but were not given an interpretation.
- You have several risk factors despite normal glucose results.
- You have symptoms of high or low blood sugar.
- Your A1C and glucose measurements do not agree.
A diabetes-range result should not be ignored. In the absence of clear symptoms or a hyperglycemic crisis, a clinician will usually confirm the result with repeat or additional testing.
Frequently Asked Questions
What is a normal insulin resistance level?
There is no universal insulin-resistance number. A1C below 5.7%, fasting glucose of 99 mg/dL or lower, and a 2-hour OGTT result of 139 mg/dL or lower are considered normal glucose ranges, but they do not directly measure insulin sensitivity.
What is a normal fasting insulin level?
The answer depends on the laboratory and assay. Mayo Clinic Laboratories, for example, lists 2.6–24.9 mcIU/mL for its fasting insulin test. Always use the reference interval printed on your own laboratory report.
Is a HOMA-IR of 2 high?
It cannot be determined from the number alone. Some research studies use cutoffs near 2, while others use higher values. HOMA-IR does not have a universally accepted diagnostic threshold.
Is a HOMA-IR above 3 insulin resistance?
A result above 3 may exceed the cutoff used in some studies, but it is not an official diagnosis. The result must be interpreted according to the assay, population, fasting conditions, glucose level, and overall health assessment.
Can A1C be normal with insulin resistance?
Yes. The pancreas may initially produce additional insulin to keep average glucose within the normal range. However, a high fasting insulin or HOMA-IR result alone does not confirm insulin resistance.
Which test is best for insulin resistance?
There is no single routine test that is best for everyone. Clinicians usually begin with A1C and fasting glucose and may use an OGTT when needed. Fasting insulin or HOMA-IR may provide supplemental information in selected situations.
Can insulin resistance improve?
Insulin sensitivity may improve with regular physical activity, sustainable weight management when appropriate, balanced eating, adequate sleep, and management of related health conditions. Some people may also benefit from medication prescribed according to their overall risk and test results.
Conclusion
An insulin resistance levels chart can help organize test results, but it should not assign a diagnosis from fasting insulin or HOMA-IR alone. Start with the validated A1C, fasting glucose, and OGTT ranges, then interpret supplemental insulin measurements in the context of your laboratory method, health history, medications, and metabolic risk factors.
Bring the complete laboratory report—not only the insulin or HOMA-IR value—to your next medical appointment so the results can be reviewed together.
This content is for informational purposes only and not medical advice.
References
- National Institute of Diabetes and Digestive and Kidney Diseases: Insulin Resistance and Prediabetes
- American Diabetes Association: Standards of Care in Diabetes—2026
- University of Oxford Diabetes Trials Unit: HOMA Frequently Asked Questions
- Mayo Clinic Laboratories: Insulin, Serum
- Centers for Disease Control and Prevention: Prediabetes Prevention